

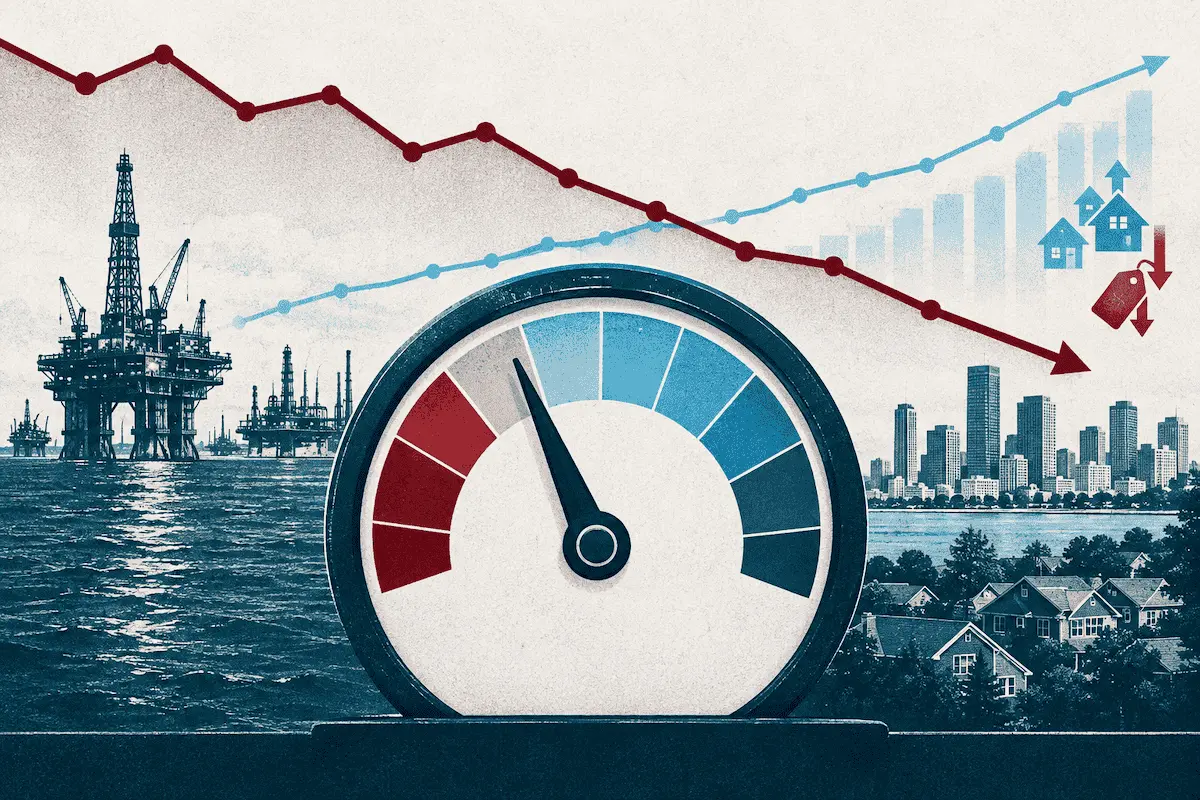
The United States housing market witnessed a tentative reprieve in its downward trajectory last week as a slight retreat in mortgage rates provided a necessary floor for consumer demand. After a period of significant stress where mortgage rates peaked at approximately 7.60%, a subsequent cooling toward the 7.30% mark was sufficient to halt the "bleeding" of buyer interest, resulting in a marginal uptick in growth during one of the most volatile weeks for the bond market in 2026. As the final week of October commences, the intersection of the 10-year Treasury yield, mortgage spreads, and geopolitical pressures has created a complex environment for real estate professionals and prospective homeowners alike.
The Pivotal Role of the 10-Year Treasury Yield
Central to the current housing narrative is the performance of the 10-year Treasury yield, which serves as the primary benchmark for 30-year fixed-rate mortgages. Throughout the month of October 2026, market analysts have identified the 5.35% level as a critical line of demarcation. Had the yield breached and sustained a position above this threshold, the industry was bracing for the "worst-case scenario" often discussed in financial circles: mortgage rates ascending to 8% or even 9%.
However, despite firm economic data and the persistence of elevated oil prices, the 5.35% resistance level held firm. This resilience was bolstered by a cooling in the high-growth artificial intelligence sector, which had previously dominated market sentiment. As the "AI story" showed signs of fatigue, investors sought the relative safety of government bonds, driving the 10-year yield back below the 5% mark. This shift allowed mortgage rates to retreat from their recent peaks, offering a temporary stabilization for a market that has been under consistent pressure since the Federal Reserve initiated its rate-hike cycle in 2022.
Industry experts, including HousingWire Lead Analyst Logan Mohtashami and Editor-in-Chief Sarah Wheeler, noted that the bond market’s "madness" during the third week of October reflected a broader uncertainty regarding global stability and domestic inflation. The ability of the market to remain below the 5.35% ceiling is currently viewed as a victory for housing stability, though the threat of a reversal remains if energy prices continue to climb.
Analyzing Mortgage Spreads and Financial Friction
While the 10-year yield provides the foundation for rates, the "mortgage spread"—the difference between the 10-year yield and the 30-year fixed mortgage rate—remains historically wide. In a balanced economic environment, these spreads typically range between 1.60% and 1.80%. Last week, however, spreads rose to 2.23%, a slight increase from 2.21% the previous week.
The widening of these spreads is a byproduct of market volatility. Mortgage spreads are inherently designed to act as a buffer against rapid fluctuations; when the 10-year yield moves sharply lower, spreads often widen to mitigate risk for lenders. Although spreads are currently trending near cycle lows relative to the start of the 2022 tightening cycle, they remain significantly higher than pre-pandemic norms. Analysts emphasize that for the housing market to see a meaningful recovery, spreads need to move closer to the 2% mark rather than the 3% territory. The current spread of 2.23% indicates that while the "bleeding" has stopped, the cost of borrowing remains disproportionately high relative to government borrowing costs.
Weekly Pending Sales: A Glimmer of Stabilization
The latest data on weekly pending home sales offers a real-time snapshot of buyer behavior. Because pending sales typically take 30 to 60 days to manifest in final closing reports, this metric serves as a leading indicator for the winter housing market. For the first time in several weeks, the week-over-week decline in pending sales ceased, posting a "smidge" of positive growth.
This stabilization is directly correlated to the dip in mortgage rates below the 7.5% threshold. Historical data from the last three years and ten months suggests that mortgage rates above 7% consistently produce soft demand data. Conversely, the market showed robust growth during the first half of 2026 when rates were maintained below 6.64%. During that period, the only significant inhibitors to demand were seasonal factors, such as holiday breaks and severe winter weather.
While the slight positive print in pending sales is an encouraging sign, economists warn against over-interpreting a single week of data. The housing market remains sensitive to minor fluctuations; the "bleeding" may have stopped, but the patient remains in a fragile state. The current level of demand is significantly lower than the highs seen in December 2025, when rates were approximately 1% lower than they are today.
Purchase Applications and the Impact of 7% Rates
Purchase application data, which provides a longer-term outlook of 30 to 90 days, paints a more sobering picture. As mortgage rates climbed above 6.64% and eventually breached 7%, application volume began a steady descent. The most recent data reflects the damage done by these elevated rates, with purchase applications showing both week-over-week and year-over-year declines.
The lag in application data means that the recent retreat in rates to 7.30% has not yet been fully captured in the reports. Market participants are watching closely to see if next week’s print will reflect the stabilization seen in pending sales. However, the broader trend for 2026 remains one of contraction. The "lock-in effect"—where homeowners with low existing rates are reluctant to sell and move into a new mortgage at 7% or higher—continues to suppress both the supply of homes and the volume of new applications.
Inventory Trends and the Seasonal Decline of New Listings
Housing inventory in 2026 has followed a unique path. While inventory growth has been "tame" for much of the year, it has begun to pick up since mid-August. Currently, inventory growth is running at 5.68% year-over-year. This increase is partly due to "easier comps," as the market compares current levels to late 2025 when demand was surging toward a nine-month high and absorbing supply rapidly.
The new listings data, however, highlights a potential concern for the remainder of the year. While 2026 has been the healthiest year for new listings since 2022—with weekly listings occasionally exceeding 80,000—last week saw a year-over-year decline. This suggests that the recent spike in rates to 7.60% may have finally discouraged potential sellers. In a healthy market, new listings during peak periods should range between 80,000 and 100,000 per week. For historical context, during the housing bubble of the mid-2000s, new listings frequently reached between 250,000 and 400,000 per week.
The current scarcity of new listings reinforces the "low-volume" nature of the 2026 market. Sellers are often buyers, and if the cost of their next mortgage is perceived as prohibitive, they simply choose not to list their current property, further tightening the available supply.
Price-Cut Percentages and the 2026 Forecast
A critical metric for gauging market heat is the percentage of homes seeing price reductions. Historically, about one-third of all listings require a price cut before a sale is finalized. For most of 2026, price-cut percentages remained lower than in 2025, indicating a relatively stable pricing environment despite high rates.
This trend shifted once mortgage rates moved above 6.64%. With rates holding above 7%, the price-cut percentage has climbed and is now 1% higher than it was at this time last year. This increase in price reductions is a direct response to falling demand. Sellers who entered the market with aggressive pricing strategies are being forced to adjust to the reality of a smaller pool of qualified buyers.
Despite these adjustments, national home prices have not seen the significant correction some anticipated. The initial 2026 housing forecast called for a modest national price decline of -0.62%. However, most major home-price indexes continue to show growth between 1% and 2%. The lack of inventory is effectively acting as a price floor, preventing a more significant decline even as affordability reaches multi-decade lows.
Geopolitical Headwinds and the Road Ahead
As the market enters the final months of 2026, several external factors threaten to disrupt the fragile stabilization in housing demand. Chief among these is the price of oil, which has hit yearly highs. High energy costs contribute to inflationary pressure, which in turn keeps upward pressure on bond yields and mortgage rates.
The ongoing conflict involving Iran remains a significant "wild card." Market analysts are concerned that geopolitical maneuvering could be used to intentionally spike oil prices. Furthermore, there is speculation regarding China’s role in the global energy market, with some suggesting that increased oil imports by Beijing could be used as a strategic tool to influence the U.S. economic landscape ahead of the midterm elections.
In addition to energy and geopolitics, the financial sector is closely monitoring the "AI story." If high-yield credit spreads begin to widen, it could signal a tightening of capital for AI projects, potentially leading to a broader market recalibration. Finally, the upcoming Federal Reserve meeting looms large. While the Fed has signaled a data-dependent approach, its commentary on inflation and the labor market will be the primary driver of bond market volatility in the weeks to come.
Conclusion: A Fragile Victory for the Housing Market
The stabilization of housing demand in late October 2026 represents a moment of equilibrium in a high-pressure environment. By maintaining the 10-year Treasury yield below the critical 5.35% mark, the market has successfully avoided a catastrophic surge toward 8% or 9% mortgage rates. However, with purchase applications remaining low and new listings beginning to falter, the market is far from a full recovery.
The remainder of the year will be defined by whether the 10-year yield can sustain its current levels amidst geopolitical unrest and fluctuating energy prices. For now, the "bleeding" has stopped, but the path toward a more accessible and liquid housing market remains fraught with macroeconomic challenges. Investors, lenders, and homebuyers must continue to navigate a landscape where volatility is the only constant.
