

Matteo Tonello, Head of Data Benchmarking and Analytics at The Conference Board, Inc., leads the analysis of a comprehensive report examining the evolution of board composition and governance practices among US public companies. This pivotal report, developed in partnership with ESGAUGE, KPMG, and Russell Reynolds Associates, and authored by Ariane Marchis-Mouren, Senior Researcher, Corporate Governance, and Andrew Jones, Director, Governance & Sustainability Center at The Conference Board, offers crucial insights into the dynamics shaping corporate leadership. The findings are derived from extensive longitudinal data, meticulously compiled from corporate filings and disclosures of companies within the Russell 3000 and S&P 500 indices, providing a detailed snapshot as of September 15, 2026. This analysis, primarily focusing on the period from 2022 through 2026, delves into critical areas such as board refreshment, director experience and skills, leadership structures, committee organization, and other practices that collectively define how boards are constituted and operate.
The year 2026 finds corporate boards navigating an increasingly complex and rapidly evolving oversight agenda. The pervasive integration of Artificial Intelligence (AI) into core business activities necessitates critical evaluations of investment strategies, workforce implications, data governance, cybersecurity risks, and overall accountability. Simultaneously, persistent geopolitical and regulatory uncertainties, coupled with fluctuating trade and policy conditions and heightened scrutiny of corporate conduct, are significantly amplifying the demands placed upon directors. Research from The Conference Board indicates that as 2026 commenced, US board directors were intensely focused on cybersecurity risks, geopolitical volatility, regulatory shifts, and the burgeoning influence of AI, alongside perennial concerns such as executive succession, enterprise risk management, and board refreshment.
These external pressures are concurrently testing the efficacy of current board operational models. Recent executive surveys consistently highlight director bandwidth limitations, slower responses to emerging risks and opportunities, and challenges in keeping pace with digital transformation as key constraints on board effectiveness. A striking nine out of ten executives surveyed identified room for improvement in the board assessment process. Against this backdrop, while board structures have remained relatively stable in 2026, notable shifts are evident in the composition of incoming director pools and the practices boards employ to sustain effectiveness. The report reveals a discernible slowdown in board refreshment rates, a decline in first-time director appointments, an increase in the average age of newly appointed directors, and a sustained emphasis on cultivating specific skills, enhancing director education, refining assessment methodologies, managing director capacity, and optimizing oversight allocation.

The overarching governance challenge in 2026, therefore, transcends the simple dichotomy of renewal versus continuity. It centers on the intricate task of preserving invaluable experience and enterprise judgment while simultaneously ensuring that the collective skills, leadership capabilities, oversight structures, and individual director capacity remain sufficiently robust and adaptable to meet the demands of a dynamic business environment.
Board Refreshment and Composition: A More Selective Approach
Refreshment Slowdown Coincides with a More Seasoned Incoming Director Pool
The trend of decelerating board turnover continued into 2026. Newly elected directors constituted 8.5% of all directors within the Russell 3000, a decrease from 9.2% in the preceding year. Similarly, for the S&P 500, this figure dropped to 8.2%, down from 9.1% in 2025. A longer-term perspective on the Russell 3000 index reveals that the 13.3% appointment rate observed in 2022 was an anomaly. From 2018 through 2021, newly elected directors consistently represented approximately 10% of the total director pool. The subsequent slowdown in turnover has been accompanied by increased continuity among incumbent directors.
A significant majority of Russell 3000 companies, specifically 52.6%, elected not to appoint any new directors in 2026. This contrasts with 43.8% of S&P 500 companies. With fewer board seats becoming available through turnover, each new appointment gains amplified influence in shaping the board’s evolving mix of experience and capabilities.

Diminished Reliance on First-Time Public Company Directors
The composition of the shrinking pool of new director appointments also underwent a transformation. First-time public company directors accounted for a reduced share of newly elected directors in 2026, dropping to 21.6% within the Russell 3000, a notable decline from 39.1% in 2025. For the S&P 500, this share fell from 27.8% to 17.6%. These 2026 percentages are also lower than those recorded in 2022 for both indices.
Furthermore, data indicates a trend of increasing age among new directors. Since 2022, the average and median age of new directors across both indices has risen by approximately two years. In 2026, the average age of new directors in the Russell 3000 climbed further to 58.5 years, up from 57.9 years, while remaining largely stable in the S&P 500 at 59.0 years. The median age remained consistent at 59.0 years and 60.0 years, respectively.
These trends collectively suggest a move towards a more seasoned pool of incoming directors. The reduced presence of first-time directors, coupled with higher average ages for new appointees, and an increased representation of active and former CEOs, indicates a stronger preference for candidates possessing prior board experience and established executive leadership credentials when filling board vacancies.

Senior Executive Experience Remains a Cornerstone of Board Composition
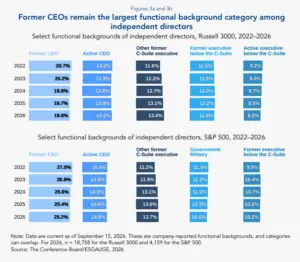
Senior executive experience continues to be the dominant functional background for independent directors. Former Chief Executive Officers (CEOs) maintained their position as the largest single group, comprising 19.8% of independent directors in the Russell 3000 and 25.2% in the S&P 500. Active CEOs represented an additional 14.2% and 14.9%, respectively. Other former C-suite executives constituted 13.4% of Russell 3000 independent directors in 2026, an increase from 11.6% in 2022, and 13.7% of S&P 500 directors, up from 11.2%.
Senior executives bring a wealth of experience in making enterprise-wide decisions spanning strategy, operations, capital allocation, risk management, talent development, and succession planning. Their familiarity with the intricate dynamics between management and the board further enhances their appeal. This continued preference is reflected in the 2026 recruitment patterns, where active and former CEOs became more prevalent among newly elected directors in both indices. When considered alongside the decline in first-time directors and the rising age of new appointees, this trend underscores an increasing reliance on candidates with established executive leadership and public company experience to fill a more limited number of board openings.
The confluence of slower refreshment rates and a greater emphasis on seasoned executive backgrounds offers the potential to strengthen board continuity and enhance collective judgment. However, it concurrently narrows the pathways for candidates who may lack prior public company leadership experience. This dynamic places increased importance on how boards meticulously define their required experience profiles and the breadth of their recruitment searches.

Board Demographics: Age, Gender, and Diversity Disclosure
Boards are Aging, But Not Necessarily Becoming Entrenched
Corporate boards continued to age throughout 2026. This trend is a direct consequence of both the slower refreshment cycles and the increasing age of incoming directors. The average director age reached 63.1 years in the Russell 3000 and 63.9 years in the S&P 500. Median ages correspondingly rose to 64.0 and 65.0 years, respectively.
This demographic shift is also evident in the age distribution of directors. Individuals aged 66 to 80 years constituted nearly two-fifths of Russell 3000 directors in 2026, an increase from 33.4% in 2022. Within the S&P 500, this share expanded from 39.0% to 44.0%.
Crucially, this aging of the board has not been accompanied by a commensurate increase in director tenure. In 2026, the average tenure of sitting directors stood at 8.1 years for the Russell 3000 and 8.2 years for the S&P 500. The proportion of directors serving beyond 15 years remained slightly below 2022 levels, at 13.4% and 13.5%, respectively.

The data collectively suggest that boards are aging primarily because directors are joining their boards later in their careers and because turnover has decreased, rather than due to an indefinite retention of long-serving directors. In terms of board refreshment, age alone serves as a weak indicator of entrenchment. The recruitment data more clearly points towards a preference for experienced candidates.
Women’s Progress in Board Leadership Amidst Shifting Appointment Trends
In 2026, women occupied 29.8% of board seats in the Russell 3000 and 34.1% in the S&P 500, representing a largely stable proportion compared to 2025. However, a more significant shift was observed in the composition of new director appointments.
Women comprised 25.6% of newly elected directors in the Russell 3000 in 2026, a decline from 31.9% in 2025. In the S&P 500, this share decreased from 36.2% to 28.7%. Among first-time directors, women’s representation saw a similar downturn, falling from 31.0% to 22.9% in the Russell 3000 and from 41.4% to 33.3% in the S&P 500.

Several factors likely contribute to this deceleration in women’s representation among new appointees. While lower board turnover inherently means fewer opportunities for compositional change, turnover alone does not fully explain the decline, as women also constituted a smaller proportion of the directors who were appointed. The appointment pattern itself has shifted, with fewer first-time directors being appointed and a greater emphasis placed on seasoned board and executive experience. Given that first-time appointments have historically served as a significant pathway for women to enter public company board service, a narrower entry path may be impeding further gains in representation.
Despite these headwinds in new appointments, leadership trends for women have shown positive momentum over the longer term. Women chaired 9.6% of Russell 3000 boards and 11.2% of S&P 500 boards in 2026, an increase from 6.6% and 6.2% in 2022, respectively. Furthermore, women held 16.9% of lead director positions in the Russell 3000 and 22.5% in the S&P 500, and chaired 33.6% and 38.8% of audit committees, respectively.
Decline in Demographic Diversity Disclosure
The disclosure of individual directors’ race and ethnicity continued its downward trajectory in 2026, mirroring a trend observed since 2025. The percentage of Russell 3000 companies disclosing the race or ethnicity of individual directors fell from 19.5% in 2024 to 11.1% in 2025 and further to 7.9% in 2026. For the S&P 500, the decline was from 42.5% to 23.0% and then to 17.2%. In 2026, a significant 66.9% of Russell 3000 companies and 41.6% of S&P 500 companies provided no board race/ethnicity disclosure.

This decline is indicative of a broader recalibration in board diversity disclosure practices. Following the US Court of Appeals for the Fifth Circuit’s decision to vacate the SEC’s approval of Nasdaq’s diversity rules, Nasdaq consequently repealed the related listing requirements in early 2025. Concurrently, the current administration has directed federal agencies to scrutinize private sector diversity, equity, and inclusion (DEI) practices deemed unlawful. While neither development explicitly prohibits companies from reporting board demographics, they have demonstrably influenced how race and ethnicity are discussed in proxy statements, particularly when disclosures are linked to recruitment commitments or targets. The net effect is a diminished empirical basis for assessing the racial and ethnic composition of corporate boards.
Notably, the proportion of US public companies disclosing a formal commitment to consider diversity in director recruitment also decreased in 2026, marked by a significant pullback in explicit diversity language within governance documents. The S&P 500 experienced a particularly sharp decline in this area, falling from 42.1% to 14.5% in a single year. However, this statistical shift does not necessarily imply a cessation of diverse candidate slate consideration or a change in search methodologies.
Director Skills and Capabilities: Disclosure Outpacing Recruitment
Board Skills Matrix Disclosure Continues to Expand
In 2026, a substantial 47.8% of Russell 3000 companies and 81.1% of S&P 500 companies disclosed their board skills matrices. While these matrices offer valuable insights into a company’s self-assessment of director experience categories, they do not independently validate the depth or recency of that expertise.

AI Expertise on the Rise, Particularly Among New Directors
Among independent directors, reported expertise in Artificial Intelligence (AI) saw an increase between 2025 and 2026, rising from 1.4% to 3.3% in the Russell 3000 and from 2.7% to 5.4% in the S&P 500. AI expertise was even more prevalent among incoming directors, with 5.5% of newly elected Russell 3000 directors and 8.8% of newly elected S&P 500 directors reported as possessing AI expertise. This figure rose further to 7.5% and 13.0%, respectively, among first-time directors.
AI expertise remains concentrated, with 7.1% of independent directors serving on information technology boards reporting such expertise, the highest proportion across any sector.
Concurrently, the reporting of broader technology expertise has seen a slight decline among all independent directors since 2025. Among newly elected directors, it dropped from 34.6% to 28.3% in the Russell 3000 and from 52.0% to 40.6% in the S&P 500. This decline may be attributable to a recalibration in how companies categorize technological expertise, with AI increasingly being recognized and reported as a distinct capability.

However, skills matrices offer limited insight into the depth of expertise. A director identified as having AI expertise may have acquired it through operational responsibilities, investment activities, advisory roles, technical leadership, or other avenues. These diverse experiences are not interchangeable. Recent research from The Conference Board underscores the critical distinction between merely having an "AI expert" on the board and possessing an "AI-capable board." Only 23% of surveyed governance executives rated their board’s AI literacy as high, with most companies opting to build oversight through existing committees, educational initiatives, and briefings rather than redesigning board architecture.
Recruit, Educate, or Access? Strategic Approaches to Capability Gaps
The presence of a capability gap on a board does not automatically necessitate the appointment of a new director. The most appropriate response hinges on whether the expertise is required to reside directly on the board, needs to be developed across the entire board, or can be accessed externally.
The fundamental question for boards is to determine the optimal balance: how much specialized capability must reside within the board itself, how much should be cultivated across the full board, and in which instances is external expertise more suitable. When boards do pursue specialist expertise, technical depth should be only one facet of the candidate’s profile. An AI or technology expert must also possess the enterprise judgment, broad perspective, and boardroom credibility necessary to effectively apply their specialized knowledge across the entirety of the board’s agenda.

Pressure-Testing Director Skills
Nominating and governance committees can leverage skills matrices as a catalyst for deeper inquiry by posing critical questions, such as: Does the matrix accurately reflect the dynamic nature of required skills? Are the defined skill categories sufficiently granular and relevant to the company’s strategic objectives? How are the depth and recency of each listed skill assessed? Does the matrix facilitate a forward-looking assessment of future skill needs?
Optimizing Board Effectiveness and Succession Planning
Assessments Gain Prominence in Board Succession and Refreshment
As boards increasingly rely less on automatic refreshment mechanisms, the weight of responsibility shifts towards assessment, education, and succession planning to identify areas where continuity is beneficial and where change is imperative.

Director education is becoming more frequently reported. Between 2022 and 2026, the proportion of companies utilizing both in-house and external educational resources rose from 20.0% to 33.0% in the Russell 3000 and from 33.7% to 50.7% in the S&P 500.
Board assessments are also becoming more comprehensive. In 2026, evaluations covering the entire board, its committees, and individual directors were conducted by 37.2% of Russell 3000 companies and 58.8% of S&P 500 companies. The use of independent facilitators for these assessments was reported by 18.4% and 40.5% of companies, respectively.
The significance lies not merely in the adoption of these practices but in their increasing expectation to inform critical decisions regarding director contributions, succession planning, committee leadership, identification of skill gaps, and individual director development.
The increasing reliance on judgment-based approaches, rather than solely on age or tenure, elevates the importance of assessments as a decision-making tool. Their true value is realized when they yield candid insights and prompt specific actions related to board composition, succession, development, or leadership, and when these actions are diligently implemented.

Refreshment Policies: Flexibility on Age, Enhanced Focus on Capacity
Age-based refreshment policies are becoming less rigid. Among companies that disclose a mandatory retirement age (917 Russell 3000 companies and 272 S&P 500 companies in 2026), age 75 continued to become more prevalent, reaching 61.2% in the Russell 3000 and 63.2% in the S&P 500 by 2026, compared to 50.9% and 49.1% in 2022. Concurrently, policies allowing for no exceptions to mandatory retirement declined to 14.1% and 25.1%, respectively.
Formal maximum tenure policies remain relatively uncommon, with 5.0% of Russell 3000 companies and 10.6% of S&P 500 companies employing them in 2026.
Conversely, policies addressing director capacity constraints are gaining traction. Overboarding policies, which apply to all directors, are in place at 56.1% of Russell 3000 companies and 86.1% of S&P 500 companies. CEO-specific overboarding policies saw an increase from 17.1% to 21.0% and from 26.9% to 30.6%, respectively, between 2025 and 2026.

Boards are demonstrating greater flexibility regarding director age while simultaneously becoming more explicit in addressing director capacity. This shift places a greater onus on nominating/governance committees and the full board to meticulously evaluate individual director contributions rather than assuming that age or tenure alone dictates effectiveness.
Judgment-based approaches offer a more nuanced ability to distinguish between directors whose contributions and capacity remain robust and those whose effectiveness may have diminished, irrespective of their age or tenure. However, this flexibility can heighten the burden on boards to conduct rigorous evaluations and to take decisive action when director performance no longer aligns with the company’s evolving needs.
Board Leadership Structures and Oversight Responsibilities: Relative Stability
Board Leadership: Stable Structures, Enhanced Independent Oversight
Board leadership structures exhibited minimal change in 2026. Independent chairs remained more prevalent in the Russell 3000 (46.3%) compared to the S&P 500 (39.4%), while current CEOs served as chair at 33.2% and 41.8% of companies, respectively. The majority of companies continued to maintain flexibility regarding the combination or separation of the Chair and CEO roles, with 71.8% of Russell 3000 companies and 78.4% of S&P 500 companies reporting a flexible leadership policy.

Independent chairs tend to be seasoned members of the boards they lead. In 2026, the median board tenure among independent chairs was 10.0 years in the Russell 3000 and 11.5 years in the S&P 500. In contrast, the median tenure specifically in the chair role was 4.1 and 3.9 years, respectively. This disparity suggests that boards frequently select chairs from among directors who possess substantial prior knowledge of the company and board operations.
A more pronounced shift is evident in the role of the lead director. While the prevalence of lead or presiding directors has not significantly increased (44.9% in the Russell 3000 in 2026, largely unchanged from 2022, and 60.8% in the S&P 500, a slight decrease from 64.7% in 2022), the responsibilities associated with the role have expanded. Between 2022 and 2026, the share of lead directors reported as setting or approving the board agenda has grown. Calling or chairing executive sessions is now nearly standard practice. The external-facing responsibilities of the lead director have also evolved more dramatically.
A well-defined lead independent director can undoubtedly strengthen independent oversight. However, the ultimate effectiveness of this role hinges on the actual authority exercised in practice, rather than solely on the title or the disclosed responsibilities.
Committee Structures Remain Stable as Oversight Allocation Evolves

Board size remained largely consistent in 2026, averaging 8.9 directors in the Russell 3000 and 10.6 in the S&P 500, with medians of nine and 11, respectively. Committee structures were similarly stable. Nearly half of Russell 3000 companies operated with three or fewer committees, compared to 26.2% of S&P 500 companies, where larger committee structures remained more common.
However, movement is more pronounced in the formation of specialized committees. Dedicated risk committees saw an increase, rising from 13.6% to 16.6% of Russell 3000 companies and from 16.6% to 18.7% of S&P 500 companies between 2022 and 2026. Science and technology committees also expanded, growing from 7.7% to 10.1% and from 15.2% to 17.0%, respectively. This growth may partially reflect where companies are allocating AI oversight. Recent research indicates that among S&P 500 companies explicitly disclosing board-level responsibility for AI, the proportion assigning it to a technology, science, or cyber committee increased from 15% in 2023 to 35% in 2025.
In contrast, ESG/sustainability committees have experienced a decline. Following their peak in 2024, their prevalence decreased from 12.8% to 11.4% in the Russell 3000 and from 20.4% to 17.6% in the S&P 500 by 2026, although both figures remain above their 2022 levels.
Sector-specific patterns are consistent with the influence of varying business models, regulatory exposures, and strategic risks. Risk committees are more prevalent in the financial sector, driven by regulatory and risk management demands. ESG/sustainability committees are more common in the energy sector, while science and technology committees are more prevalent in healthcare.

The fundamental issue is not merely the naming of committees but the strategic allocation of oversight responsibilities. The appropriate board and committee structure should accurately reflect a company’s complexity, industry sector, regulatory environment, risk profile, and overarching strategic priorities.
Conclusion: A More Selective Path to Board Adaptation
The data from 2026 reveal a corporate governance landscape characterized by a more selective model of board adaptation. Board refreshment rates have slowed, while boards are placing a greater emphasis on prior board and executive experience. Furthermore, there is an increased reliance on comprehensive assessments, targeted director education, robust capacity policies, and strategic adjustments in oversight responsibilities to effectively navigate an increasingly demanding operating environment.
This approach offers the potential to preserve continuity and retain valuable institutional knowledge. However, it concurrently elevates the importance of informed board judgment. Key questions arise: Are directors remaining effective? Do disclosed skills translate into tangible capabilities? Are existing leadership and committee structures still optimally suited for current challenges? The ultimate test will be whether boards consistently and rigorously assess their composition and proactively act when company needs evolve or when director effectiveness warrants adjustments.
This article is based on corporate disclosure data from The Conference Board Benchmarking platform, powered by ESGAUGE.
