

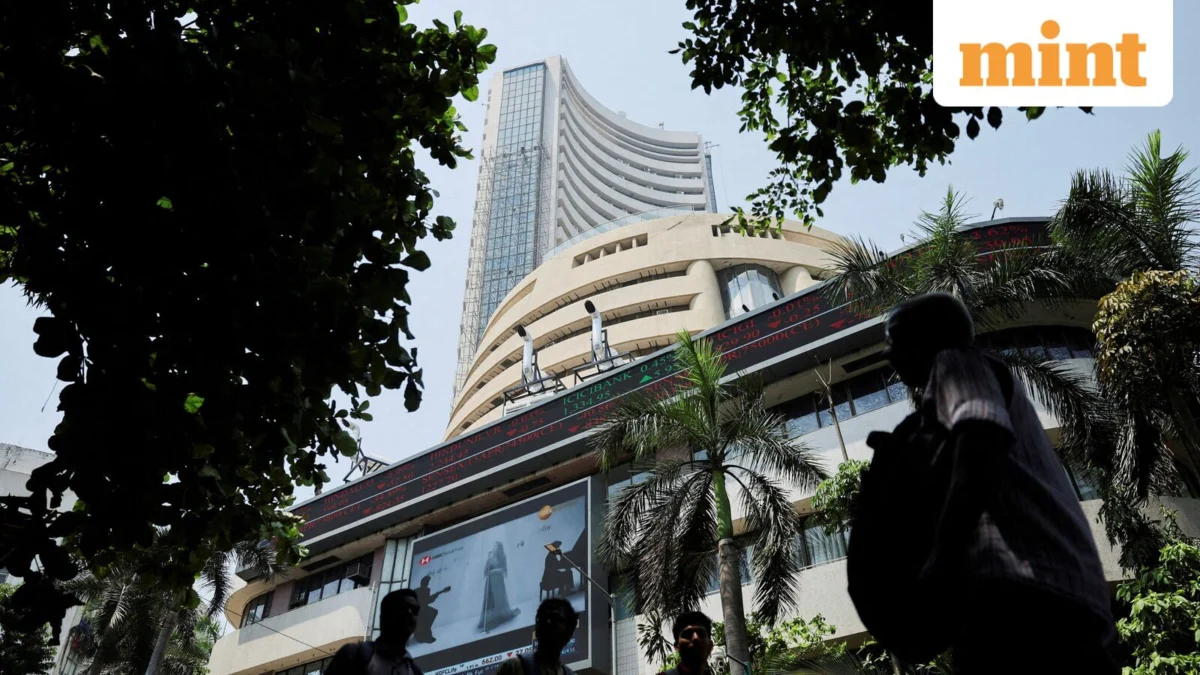
The Indian equity market concluded the final trading session of September on a notably weak note, with the benchmark Nifty 50 index retreating from its intraday highs to finish in the red. This performance capped off a challenging month for domestic investors, as the index surrendered more than 180 points from its daily peak of 22,809.35, marking the third consecutive session of decline. The volatility observed on the final day of the month is emblematic of a broader bearish trend that has gripped the Dalal Street ecosystem, leaving market participants searching for signs of a definitive bottom.
September 2026 proved to be a historically difficult period for the Indian markets. The Nifty 50 index plummeted nearly 6% over the course of the month, recording its sharpest monthly decline since the volatility of March 2026. Furthermore, this represents the steepest September fall since 2016, a statistic that underscores the severity of the recent selling pressure. While the broader market has faced headwinds from global macroeconomic shifts and fluctuating foreign institutional investor (FII) flows, the technical damage to the charts suggests a period of consolidation or a technical rebound may be imminent, given the extreme oversold conditions now present.
Technical Analysis: Candlestick Patterns and Price Action
The price action on the final day of September resulted in the formation of a small, red-bodied candlestick characterized by a long upper shadow. In technical parlance, this "shooting star-like" appearance indicates that while bulls attempted to push the market higher during the session, they were met with aggressive selling pressure at elevated levels. Although the index managed to form a higher high and a higher low compared to the previous day’s session, the lack of a strong closing suggests that the bears remain firmly in control of the narrative.
A "hammer" formation—a bullish reversal signal—was attempted during the session but failed to receive the necessary confirmation from follow-through buying. For a meaningful reversal to be validated, technical analysts argue that the Nifty 50 must produce a strong positive green candle on high volume, effectively closing above the previous session’s high of 22,809. Until such a move occurs, the market remains in a "sell on rallies" mode, where any upward movement is viewed by traders as an opportunity to exit long positions or initiate fresh shorts.
The Eight-Week Cycle and Fibonacci Significance
As the market enters the first week of October, it does so against the backdrop of a prolonged downtrend that has lasted nearly eight consecutive weeks. Technical researchers often look to Fibonacci sequences—where eight is a key number—to identify potential turning points in market cycles. The duration of this decline suggests that the bearish momentum may be reaching a point of exhaustion.
The proximity of a long weekend often leads to reduced market participation, which can result in lower liquidity and heightened sensitivity to small trades. However, the confluence of the eight-week cycle and the index’s approach toward its 200-week moving average (WMA) provides a glimmer of hope for contrarian investors. The 200-WMA is a critical long-term support level that historically acts as a floor during major market corrections. Currently, the immediate support zone for the Nifty 50 is identified between the 22,500 and 22,600 levels. Should the index breach this floor, the next leg of the decline could test much deeper psychological levels.
Momentum Indicators: Navigating the Oversold Territory
The Relative Strength Index (RSI), a widely used momentum oscillator, has dropped to a reading of 25.27. Traditionally, an RSI below 30 is classified as "extreme oversold," suggesting that the asset has been sold too aggressively in a short period. While oversold conditions can persist during powerful bear markets, they often precede a "mean reversion" where the price bounces back toward its moving averages.
Currently, the Nifty 50 is trading approximately 5.36% below its 50-day moving average (50-DMA). The widening gap between the current price and the 50-DMA, combined with downward-sloping Bollinger Bands, indicates that the decline has become stretched. While the Moving Average Convergence Divergence (MACD) remains deep in negative territory below the zero line—confirming the strength of the current downtrend—the sheer velocity of the fall increases the probability of a counter-trend rally. Such rallies are often sharp and fast, driven by short-covering from traders who are locking in profits on their bearish bets.
Critical Levels for Recovery
For the Nifty 50 to signal an early recovery, it must overcome a series of technical hurdles. The first point of contention is the 8-day Exponential Moving Average (8-EMA), currently positioned at 22,971. This level has acted as a dynamic resistance throughout the recent slide. Beyond the 8-EMA lies the 23.6% Fibonacci retracement level at 23,090, calculated from the recent swing high to the current lows.

A sustained close above 23,090 would be the first major sign that the bulls are regaining some footing. Conversely, if the index fails to hold the 22,500 support zone, it could trigger a fresh wave of panic selling, as institutional stops are likely clustered just below that mark.
Stock in Focus: Sona BLW Precision Forgings
Amidst the broader market gloom, Sona BLW Precision Forgings (Sona Comstar) has emerged as a beacon of relative strength. The stock is currently exhibiting signs of a potential bullish breakout from a seven-week flat base pattern. This consolidation phase, occurring while the broader index was falling, suggests strong underlying demand for the company’s shares.
The stock has tested its pivot level of ₹836 four times in the last six trading sessions, indicating a persistent attempt by buyers to break through overhead supply. This price action has been accompanied by higher-than-average trading volumes over the past three weeks, a classic sign of institutional accumulation. The Relative Strength (RS) line for Sona BLW has reached a new high, confirming that the stock is significantly outperforming the Nifty 50.
Technical indicators for Sona BLW are aligning for an upward move:
- MACD: Has generated a fresh bullish crossover.
- RSI: Approaching the "strong bullish" zone (above 60).
- Bollinger Bands: Starting to expand, suggesting an increase in volatility that typically precedes a breakout.
- Elder Impulse System: Recently printed a strong bullish bar.
A decisive move and close above ₹836 could propel the stock toward a target of ₹890. For risk management, analysts suggest a stop-loss at ₹812, which lies just below the recent consolidation support.
Broader Market Implications and Economic Context
The weakness in the Indian markets during September 2026 cannot be viewed in isolation. Analysts point toward a combination of domestic and global factors that have weighed on sentiment. Domestically, there are concerns regarding the pace of corporate earnings growth as the Q2 FY27 earnings season approaches. High interest rates have also begun to impact discretionary spending, reflected in the lackluster performance of the auto and retail sectors.
Globally, the strengthening of the US Dollar and rising yields on US Treasuries have led to a "risk-off" sentiment, prompting foreign investors to pull capital out of emerging markets like India. The 6% decline in a single month suggests that much of this negativity may already be priced into the Nifty 50.
However, the resilience of specific sectors, such as auto components (as seen in Sona BLW), suggests that the market is becoming increasingly bifurcated. While the "index heavyweights" in the banking and IT sectors have dragged the benchmark lower, mid-cap stocks with strong fundamental stories continue to attract interest.
Outlook for October
As the market transitions into October, the primary focus for investors will be whether the support at 22,500 holds. A successful defense of this level, combined with the oversold RSI readings, could set the stage for a "relief rally" that carries the Nifty 50 back toward the 23,200–23,500 range.
Investors are advised to remain cautious and avoid aggressive long positions until a reversal is confirmed by price action. The coming sessions will be crucial in determining whether the September slump was a healthy correction in a long-term bull market or the beginning of a more structural downtrend. For now, the "oversold" status of the market remains the strongest argument for a short-term bounce, providing a window of opportunity for nimble traders to capitalize on a potential counter-trend move.
