

Paul Hodgson and Andrew Jones, Senior Contributor and Principal Researcher respectively at The Conference Board’s Governance & Sustainability Center, have released a comprehensive report examining the intricate ways US public companies are integrating financial and nonfinancial performance metrics into their executive compensation structures. The analysis, drawing from data for the 2023, 2024, and 2025 filing years for Russell 3000 and S&P 500 companies, reveals a strategic refinement rather than a wholesale abandonment of nonfinancial measures, signaling a shift in board priorities and a more discerning approach to executive accountability.

The report, based on extensive analysis of proxy statements, particularly the Compensation Discussion and Analysis (CD&A) and Summary Compensation Tables (SCT), offers crucial insights into the prevalence, weighting, and implications of these metrics in both short-term incentive (STI) and long-term incentive (LTI) plans. Hodgson and Jones emphasize that the current trend indicates a move towards greater selectivity in nonfinancial metrics, aligning with evolving investor expectations and a broader understanding of sustainable value creation.
Defining the Metrics: Beyond the Balance Sheet
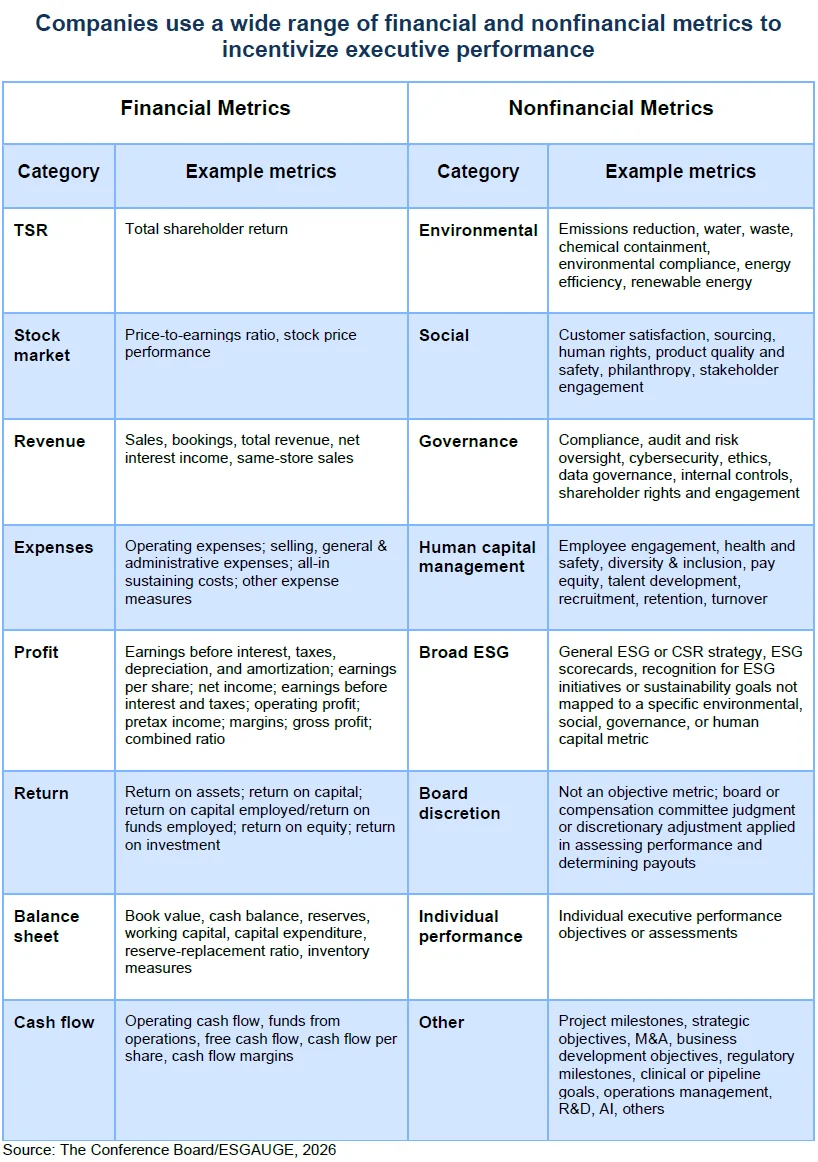
At its core, executive incentive compensation has historically been anchored in financial performance. Metrics such as revenue, profit, cash flow, return on investment, balance sheet strength, and Total Shareholder Return (TSR) have long served as the primary yardsticks by which boards evaluate management’s delivery on financial objectives. However, the report underscores that a growing number of companies are incorporating nonfinancial metrics to capture crucial dimensions of performance that might be overlooked by purely financial indicators.
Financial metrics, as defined by the report, are directly quantifiable measures derived from financial statements, market valuations, capital market performance, or economic returns. These are the traditional pillars of executive pay, providing a clear link to the company’s bottom line and shareholder value.
Conversely, nonfinancial metrics encompass a broader spectrum of performance indicators tied to operational execution, strategic implementation, workforce management, governance practices, environmental and social stewardship, board discretion, and individual performance. This category notably includes Environmental, Social, and Governance (ESG)-related measures, though the report clarifies that specific environmental, social, governance, and human capital metrics are captured separately from broad ESG scores. This distinction is vital, as it highlights a move away from generic ESG labels towards more targeted and business-specific performance indicators.
A critical point made by Hodgson and Jones is that nonfinancial metrics are not inherently "soft" or less rigorous. When clearly defined and linked to strategic objectives, they can effectively measure progress in areas such as operational safety, regulatory compliance, customer satisfaction, workforce stability, and the achievement of strategic milestones. The significance and rigor of these metrics are contingent upon their definition, the business model, the time horizon of the incentive plan, the type of plan, and the weight assigned. For instance, a safety modifier within a short-term incentive plan serves a different purpose and carries different weight than assigning 30% of an annual bonus to human capital or customer-centric goals.
Furthermore, the report draws a clear distinction between performance metrics and board or compensation committee discretion. Discretion, whether applied to financial or nonfinancial measures, is an act of judgment in assessing results or determining payouts, not a performance measure in itself. The authors caution that even seemingly objective financial metrics can lose transparency through non-GAAP adjustments or discretionary carve-outs. In some instances, a well-defined nonfinancial metric tied to strategy, risk management, or long-term value creation can be more rigorous than a financial metric heavily reliant on discretionary adjustments.
The Rise of Nonfinancial Metrics in Short-Term Incentive Plans
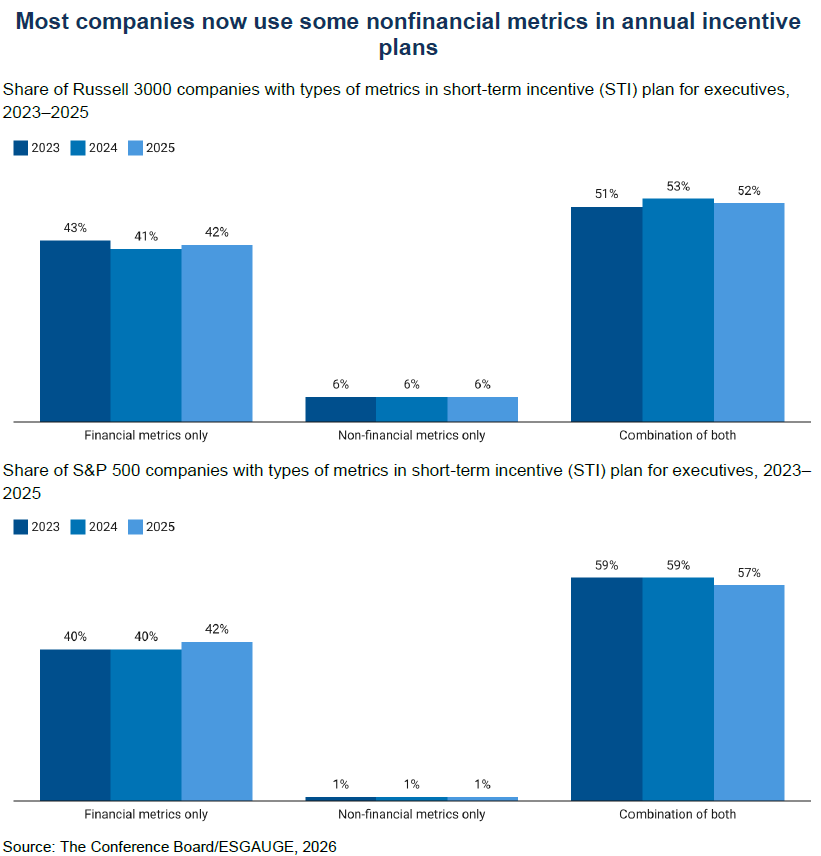
The integration of nonfinancial performance metrics into Short-Term Incentive (STI) plans has become a mainstream practice among US public companies. The report’s analysis, covering data from 2023 to 2025 for both the Russell 3000 and S&P 500 indices, indicates that while a significant portion of companies (over half in both indexes) employ a combination of financial and nonfinancial metrics, a substantial minority (just over two-fifths) still rely exclusively on financial measures.
Notably, the overall composition of STI metrics has remained relatively stable over the three-year period examined. While there was a modest shift towards financial-only plans in 2025, the data does not suggest a broad retreat from nonfinancial measures. Instead, boards appear to be recognizing the value of balancing financial discipline with a more holistic view of executive performance, particularly in the short term where operational and strategic execution is paramount.
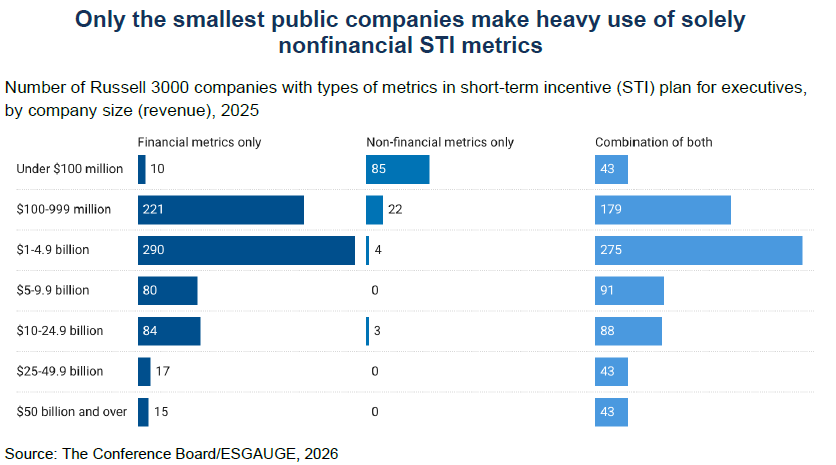
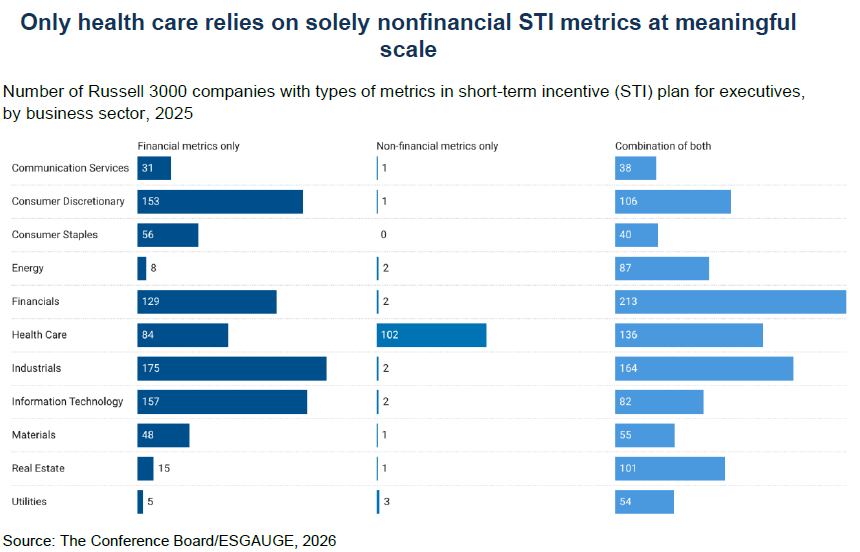
The exclusive use of nonfinancial STI metrics remains rare across most industries, with the healthcare sector standing out as a significant exception. In 2025, nearly one-third of healthcare companies utilized solely nonfinancial STI metrics, a figure substantially higher than any other sector. This pattern is attributed to the diverse business models within healthcare. For pre-commercial biopharmaceutical companies, near-term financial outcomes may be less relevant than progress in clinical trials, regulatory approvals, product development, and pipeline advancement. For healthcare providers and payers, nonfinancial measures such as business development objectives, patient outcomes, quality of care, service excellence, workforce retention, compliance, and regulatory milestones are critical drivers of success.
The report also highlights a correlation between company size and the exclusive use of nonfinancial STI metrics. Among companies with annual revenues under $100 million, a striking 62% relied exclusively on nonfinancial STI metrics in 2025. This contrasts sharply with only 7% using solely financial metrics in this revenue tier. This trend is attributed to the developmental stage of these smaller public companies. Profitability may be volatile or delayed, making annual incentive design more appropriately tied to operating, developmental, or strategic milestones. Nonfinancial metrics in this context help boards assess capability building, operational scaling, and near-term priority execution. As companies mature and grow, investor expectations often shift, with larger and more established firms facing greater pressure to demonstrate financial discipline and align pay with robust financial performance.
Refining the Metric Mix in STI Plans
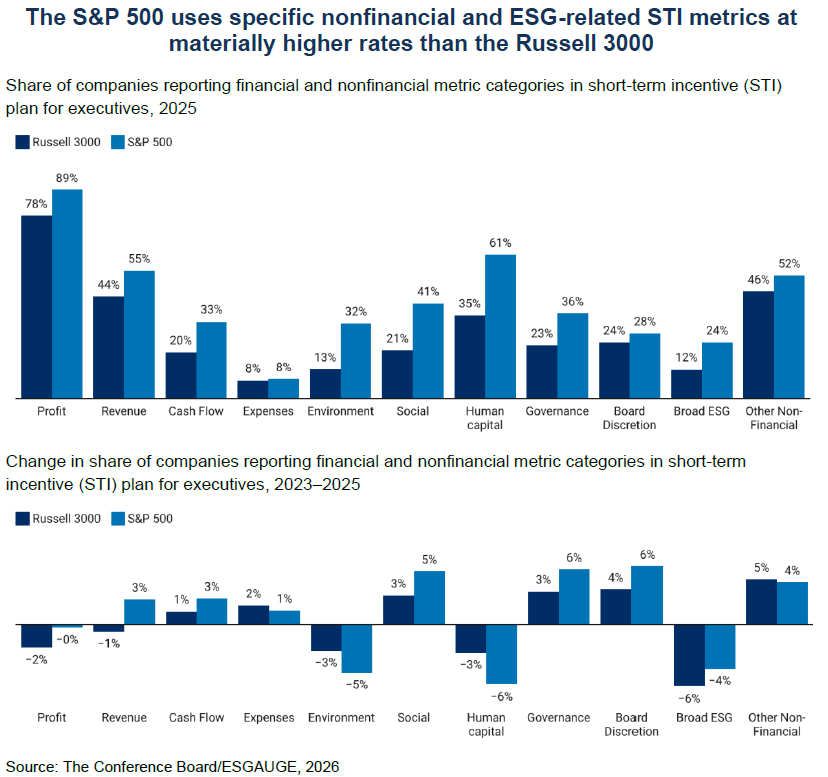
Beyond the prevalence of nonfinancial metrics, the report delves into the specific types of financial and nonfinancial measures being incorporated into STI plans. The analysis reveals a trend of selective refinement rather than a broad overhaul. While financial measures, particularly profit and revenue, continue to form the bedrock of annual incentive design, boards are adjusting the supporting metric mix. This includes an increased emphasis on operational, governance, social, cash flow, and expense management metrics. Concurrently, there appears to be a move away from broad ESG labels and, in some cases, specific environmental and human capital metrics, suggesting a preference for more targeted and directly business-relevant indicators.
The data indicates a notable difference in metric prevalence between the S&P 500 and the Russell 3000. In 2025, the S&P 500 showed a higher prevalence of human capital (26 percentage points), social metrics (20 points), environmental metrics (19 points), governance metrics (14 points), and broad ESG labels (12 points) compared to the Russell 3000. This disparity is significant for benchmarking purposes, suggesting that large-cap companies are not simply scaling the practices of broader public companies but are often adopting distinct approaches.
The implication here is not a wholesale discard of ESG metrics but a strategic pivot. Companies are reportedly moving away from generic ESG labels towards more tailored, business-specific nonfinancial measures that can be more directly linked to execution, risk management, workforce productivity, operational efficiency, customer outcomes, or core business strategy.
Weighting of Metrics in STI Plans
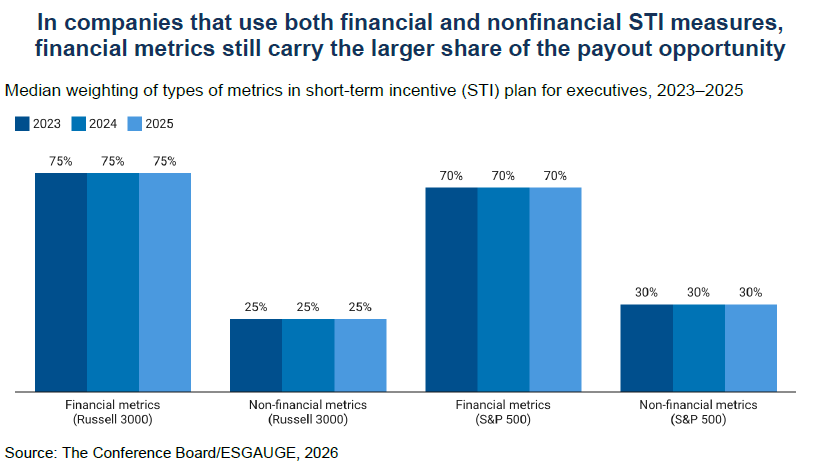
The weighting assigned to financial versus nonfinancial metrics in STI plans provides further insight into board priorities. For companies that disclose relative weightings, the typical split in the S&P 500 is approximately 70% financial and 30% nonfinancial. In the Russell 3000, this ratio is closer to 75% financial and 25% nonfinancial. While large-cap companies generally assign slightly greater weight to nonfinancial measures than their smaller and mid-cap counterparts, financial outcomes consistently remain the primary driver of annual incentives.
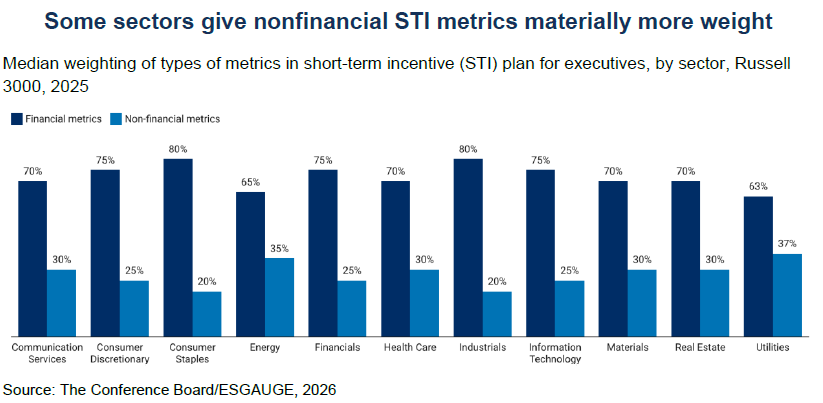
Sector-specific differences in weighting are also evident. In the energy and utilities sectors, nonfinancial measures constitute over one-third of performance assessment. In healthcare, they account for approximately 30%, exceeding the Russell 3000 median of 25%. These variations are likely reflective of the core value and risk drivers within these industries. For healthcare, nonfinancial metrics often capture critical aspects like clinical progress, regulatory hurdles, developmental milestones, and patient-centric performance. In energy and utilities, nonfinancial metrics are frequently tied to safety, environmental stewardship, system reliability, operational discipline, and regulatory compliance. These are not superficial additions but integral components that can significantly impact value preservation and enterprise risk management on an annual basis.
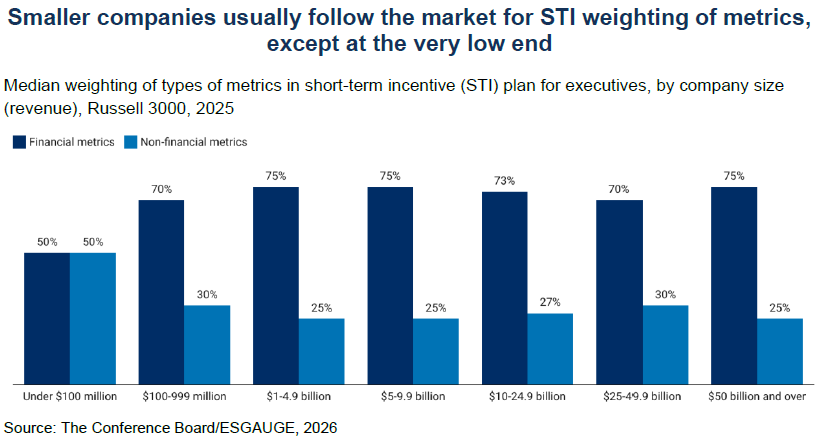
By company revenue, most firms align with the broader Russell 3000 pattern of approximately a 75:25 financial-to-nonfinancial split. An exception is observed in companies with annual revenues under $100 million, where the split is a more balanced 50:50. This suggests that the smallest public companies are more inclined to assign equal weight to nonfinancial metrics as core indicators of management performance, rather than treating them solely as modifiers. As companies scale, incentive structures tend to become more standardized, with a corresponding rise in the relative weight of financial metrics.
Nonfinancial Metrics in Long-Term Incentive Plans: A Different Ballgame
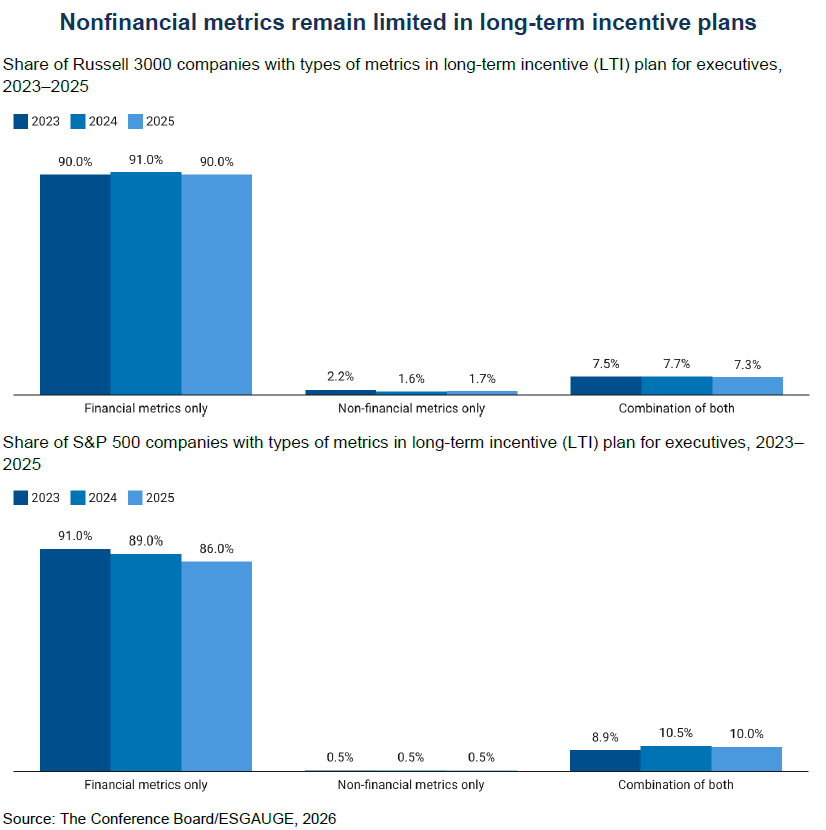
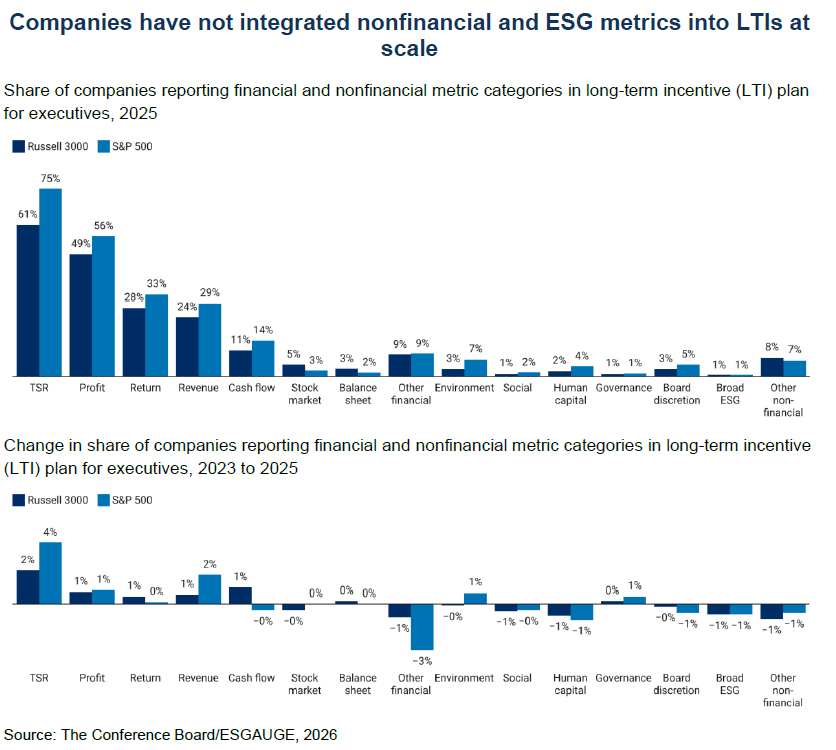
The landscape shifts considerably when examining Long-Term Incentive (LTI) plans. In contrast to STIs, ESG and other nonfinancial measures are used far less frequently in LTIs, both in plans that combine financial and nonfinancial metrics and, even more pronouncedly, in those relying solely on nonfinancial measures. This distinction between STI and LTI design is revealing: boards appear more comfortable using nonfinancial metrics to influence annual pay outcomes than to shape compensation over longer, multi-year horizons.
LTIs, by their nature, are designed to align executive behavior with long-term value creation and shareholder returns. Consequently, most companies continue to assign nearly all weight to financial performance and TSR in their LTI frameworks. This underscores the role of LTIs as the component of the compensation program most directly linked to capital market discipline and sustained value realization.
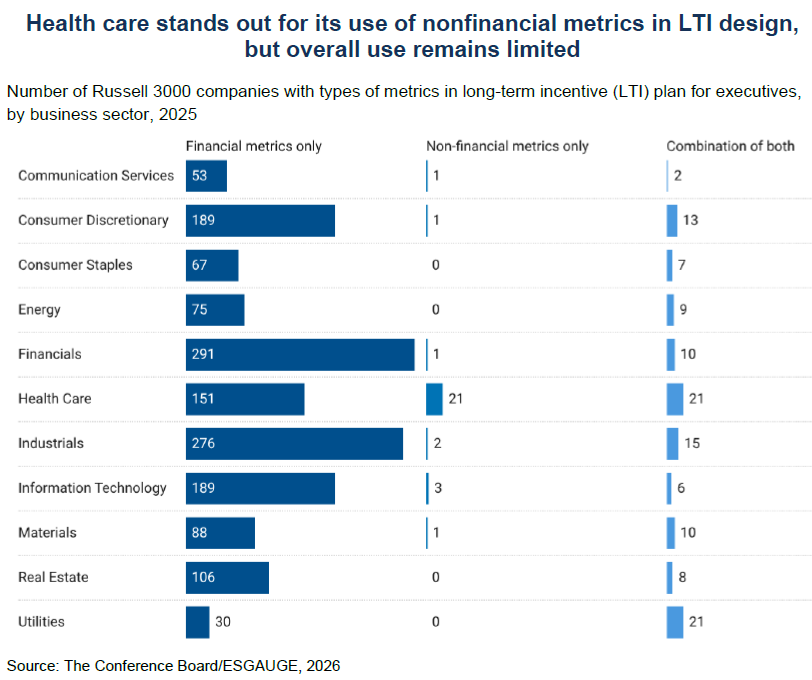
Across most industries, the number of companies employing exclusively nonfinancial metrics in LTIs is either negligible or in the single digits. The healthcare sector again emerges as a notable outlier, driven by its inherent reliance on clinical development, human capital management, service quality, regulatory achievements, and other nonfinancial outcomes. Healthcare also exhibits the highest number of companies using a combination of financial and nonfinancial metrics in their LTIs. Other sectors with double-digit use of combined metrics include consumer discretionary, financials, industrials, materials, and utilities. However, even within these sectors, the integration of nonfinancial metrics into LTIs remains significantly less prevalent than in STIs.
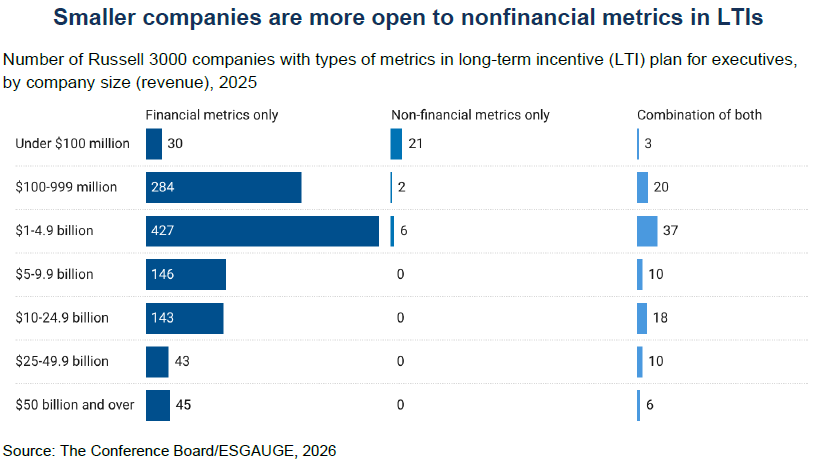
Smaller companies demonstrate a greater propensity to incorporate nonfinancial metrics into their LTI plans. They are more likely to utilize either exclusively nonfinancial metrics or a blend of financial and nonfinancial measures. This pattern is likely attributable to differences in business maturity, growth profiles, and governance needs. Smaller companies are often in the process of building their operations, leadership teams, product pipelines, and strategic market positions. Boards at these firms may use LTIs not only to reward long-term financial success but also to reinforce developmental or execution priorities. Growth-stage companies may also find it challenging to set reliable three-year financial targets, making well-defined nonfinancial milestones more relevant for incentivizing progress. Larger, more established companies, conversely, tend to have more standardized compensation frameworks and face greater external scrutiny, which often steers their LTI structures towards more traditional financial and market-based approaches.
Metric Mix and Weighting in LTI Plans: A Conservative Approach
The analysis of specific LTI metric categories further reinforces the more conservative approach to long-term incentives compared to short-term ones. LTIs remain firmly anchored in shareholder return and overall financial performance, with nonfinancial and ESG-related metrics being employed selectively and with considerably less prevalence.
The S&P 500 shows a higher prevalence of conventional LTI metrics, such as TSR (14 percentage points higher than Russell 3000), profit (7 points higher), revenue (5 points higher), return (5 points higher), and cash flow (3 points higher). Among nonfinancial metrics, the premiums are considerably smaller, with environmental metrics at 4 percentage points, human capital at 2 points, and board discretion at 2 points. This indicates that companies are not broadly migrating nonfinancial and ESG metrics into LTI plans. Boards continue to reserve LTIs primarily for rewarding shareholder return, profitability, capital efficiency, revenue growth, and cash flow generation. Where nonfinancial LTI metrics are utilized, they appear to be company-specific and selectively chosen rather than part of a widespread market trend.
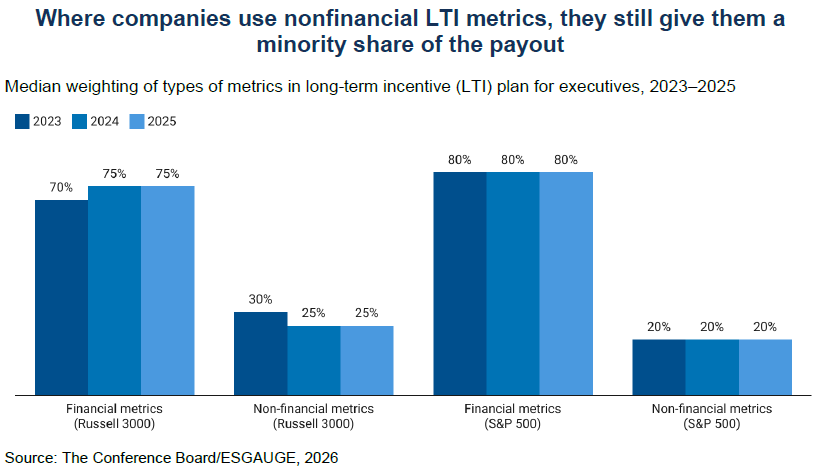
When examining the weighting of metrics in LTIs for companies that disclose this information, nonfinancial measures typically constitute between 20% and 30% of the total weighting. In the Russell 3000, the median split was 75% financial to 25% nonfinancial in 2024 and 2025, with a slightly higher proportion of nonfinancial metrics (30%) in 2023. In the S&P 500, the median split remained consistently at 80% financial to 20% nonfinancial throughout the period. It is important to note that the weighting analysis is based on a smaller sample of companies that provide this detailed disclosure, and thus results should be interpreted directionally. Nevertheless, the implication is clear: even where nonfinancial metrics are present in LTIs, they generally play a secondary role.
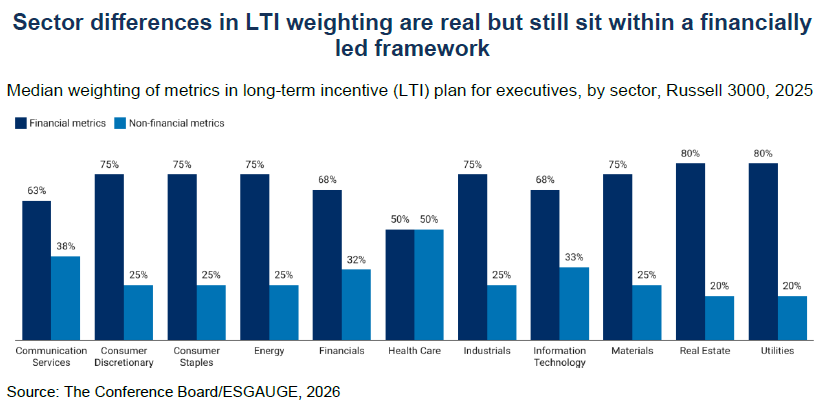
Industry-level weighting analysis largely mirrors these broader trends. In certain sectors, particularly healthcare, nonfinancial metrics can account for as much as half of the total LTI weighting. In contrast, sectors like communication services, financials, and information technology exhibit a split closer to two-thirds financial and one-third nonfinancial. These variations suggest that the inclusion of nonfinancial metrics in LTIs is often driven by sector-specific rationales. Some industries possess business models where talent development, customer outcomes, innovation, regulatory adherence, clinical advancement, or operational resilience are intrinsically linked to long-term value creation. However, for the majority of sectors, financial performance remains the dominant driver of long-term incentives.
Analysis by company size, while based on smaller sample sizes and requiring cautious interpretation, also points to a relatively greater reliance on nonfinancial metrics in LTI plans among smaller companies. This, combined with prevalence data, suggests a consistent pattern: smaller firms exhibit more flexibility in how they reward long-term performance. This flexibility is likely a reflection of their developmental stage, where incentives may need to capture strategic and organizational progress alongside financial outcomes, especially given the challenges in setting reliable multiyear financial targets.
Conclusion: A Nuanced Evolution in Executive Compensation
The integration of nonfinancial metrics into executive pay is frequently viewed through the narrow lens of whether companies are adopting or retreating from ESG-linked compensation. However, the findings from The Conference Board report reveal a more nuanced evolution. Boards are not abandoning nonfinancial measures; rather, they are becoming increasingly selective about which metrics are incorporated into pay plans and how these metrics are meaningfully connected to specific business performance objectives.
Investor expectations are also evolving. While many investors remain cautious about metrics that are difficult to measure, poorly disclosed, or disconnected from financial results, there is a growing recognition that sustainable long-term value creation extends beyond traditional earnings or TSR figures. Boards face the dual challenge of maintaining financial discipline while demonstrably showing how carefully selected nonfinancial metrics contribute to organizational resilience, effective execution, and durable value creation.
The report also emphasizes that the same level of scrutiny should be applied to the use of discretion in compensation decisions. A financial metric is not inherently more rigorous simply because it is financial, especially if it relies heavily on non-GAAP adjustments or discretionary carve-outs. Conversely, a nonfinancial metric is not necessarily less rigorous if it is not directly derived from financial statements or stock prices. The ultimate test for any metric, regardless of its label, lies in its objectivity, measurability, materiality to the business, understandability, appropriate weighting, and clear disclosure.
Looking ahead, the next phase of nonfinancial metrics in executive compensation may diverge from the ESG-focused metrics of the past decade. As companies increasingly invest in areas such as artificial intelligence, automation, data governance, cybersecurity, workforce redesign, and productivity enhancements, boards may explore metrics tied to digital transformation, advanced risk controls, employee reskilling initiatives, productivity gains, or the responsible use of AI. These emerging metrics will, however, face the same fundamental test: they must be specific, measurable, rigorous, transparent, and demonstrably material to the company’s strategic objectives and long-term success.
