


The financial strength of the United States’ largest university endowments has seen a remarkable surge over the past decade, with the top 17 institutions collectively expanding their assets from approximately $249 billion in Fiscal Year 2016 to a formidable $426 billion by FY2025. This substantial growth, representing an increase of roughly 70-73%, is a testament to a confluence of robust investment performance and significant new philanthropic contributions. However, beneath this impressive aggregate figure lies a complex landscape of diverse investment strategies, varying risk appetites, and a discernible gap when compared to their global institutional counterparts. This analysis, drawing from the 2025 NACUBO-Commonfund Study of Endowments, individual fund reports, and advanced risk modeling from FIS-APT, aims to illuminate the strategic nuances, risk profiles, and efficiency levels exhibited by these leading university endowments.
A Decade of Growth: Outperformance and Divergent Leadership
The period from FY2016 to FY2025 has been characterized by strong overall returns, yet the long-term performance leaders reveal a nuanced picture of strategic success. The combined Assets Under Management (AUM) for the 17 largest U.S. university endowments grew from around $247 billion to approximately $426 billion, a testament to both market appreciation and ongoing donor generosity.
Table 1: AUM Growth and Net Returns: Top 17 Endowments (FY2016-FY2025)
(Image of Table 1 showing AUM growth and net returns for top endowments)
Note: Source: 2025 NACUBO-Commonfund Study of Endowments; individual endowment annual reports. Returns are net of investment management fees and exclude distributions and operating expenses. AUM growth reflects investment returns and net new gifts. Some figures estimated where not publicly disclosed.
In the most recent fiscal year, FY2025, the University of Michigan led the pack with an impressive net return of 15.5%. Close behind were MIT at 14.8%, Washington University in St. Louis at 14.7%, and Stanford University at 14.3%. Looking at longer time horizons, the picture becomes more varied. Over a five-year span, Michigan, Stanford, Notre Dame, WashU, and MIT have all achieved annualized returns exceeding 12%. A ten-year perspective reveals MIT, Michigan, Stanford, Notre Dame, and Duke as the leading performers. Notably, Harvard University, despite managing the largest AUM at $57 billion, posted a ten-year return of 8.2%, the lowest among the top five by asset size. This highlights a critical observation: consistent one-year outperformance does not always translate into sustained long-term compounding success.

Three Philosophical Pillars: Divergent Paths to Endowment Management
The strategies employed by the largest endowments reveal three distinct philosophical approaches, each with its own risk and return implications. Examining Harvard, Yale, and Michigan offers a compelling snapshot of this diversity.
Table 2: Three Endowment Case Studies: Harvard, Yale, and Michigan (FY2025 Standardized Allocation Categories)
(Image of Table 2 showing standardized allocation categories for Harvard, Yale, and Michigan)
Note: Source: FY2025 institutional reports and APT/UMass standardized allocation mapping. Categories are presented in comparable asset-class buckets and may differ from each institution’s exact public-report labels. Rows may not sum to 100% due to rounding and category mapping.
-
Harvard: The Concentration Model
Harvard’s endowment, the largest among its peers, exemplifies a concentration strategy, with 41% allocated to private equity and 31% to hedge funds, notably excluding a venture capital sleeve. This approach embraces significant illiquidity and manager concentration in pursuit of private market return premia. While Harvard has demonstrated strong recent one-year performance (11.9%), its ten-year return of 8.2% reflects the strategic adjustments and the inherent costs associated with earlier transitional phases in its portfolio construction. This model prioritizes potential alpha generation through specialized investments, accepting the trade-off of reduced liquidity. -
Yale: The Diversified Alternatives Model
Widely recognized as the originator of the diversified alternatives model, Yale’s endowment represents the blueprint that has influenced much of the institutional investment industry. Its allocation—24% in venture capital, 20% in private equity, and 22% in hedge funds—underscores a commitment to broad diversification across alternative asset classes. This strategy, pioneered by the late David Swensen, has become a benchmark against which other endowments are measured. Yale’s consistent performance, with an 11.1% one-year return and a 9.4% ten-year annualized return, demonstrates the power of disciplined diversification in achieving steady long-term compounding. -
Michigan: The Growth-Concentrated Model
The University of Michigan’s endowment, the top performer in FY2025 with a 15.5% net return, showcases a growth-concentrated strategy. With 33% in venture capital and 11% in private equity, complemented by 13% each in hedge funds and real assets, Michigan’s portfolio is heavily weighted towards high-growth potential assets. This strategic posture has yielded a 13.7% five-year and a 10.4% ten-year annualized return, indicating a durable approach that has weathered multiple market cycles, rather than a singular outcome driven by recent market trends like AI valuations.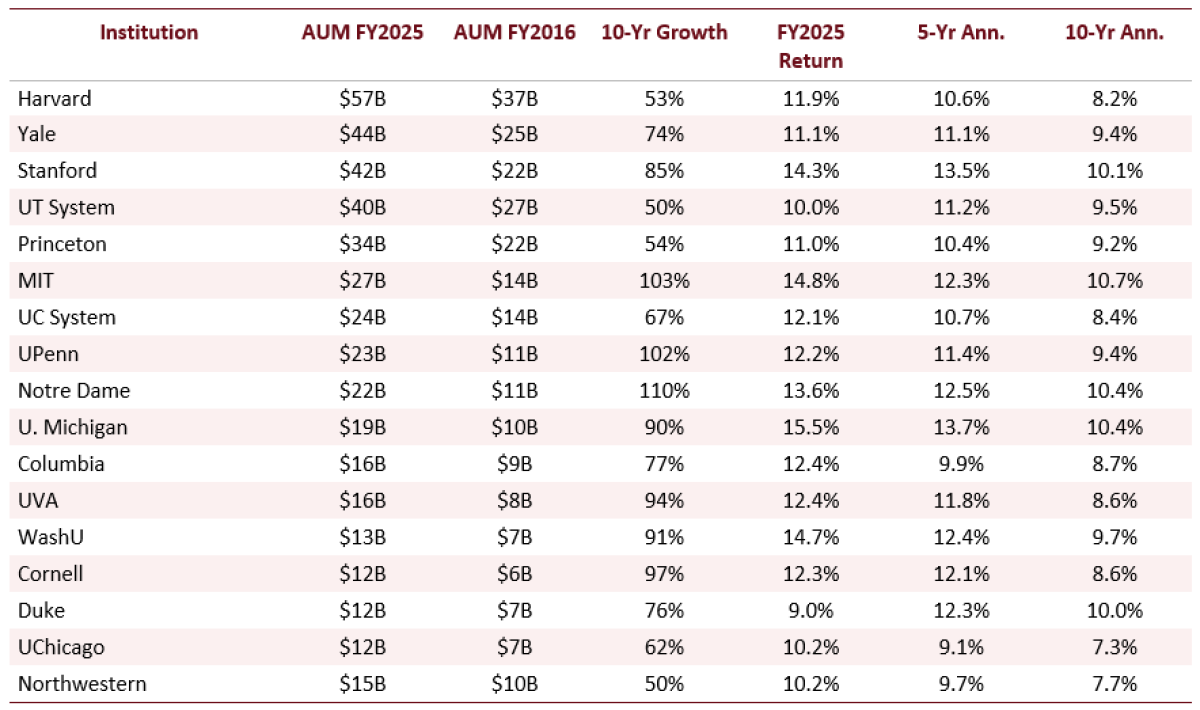
These three institutions collectively illustrate that there is no single, universally applicable path to achieving long-term investment outperformance. Each strategy carries distinct risk-return characteristics and is suited to different institutional objectives and risk tolerances.
Diversification’s Nuances: Real Assets and Hedge Funds as Risk Mitigators
While the broader trend among endowments has been a significant pivot towards alternative investments, the effectiveness of these diversifiers in mitigating risk is not uniform. An examination of ex-ante correlation estimates from the FIS-APT model reveals key distinctions, particularly between private equity and hedge funds.
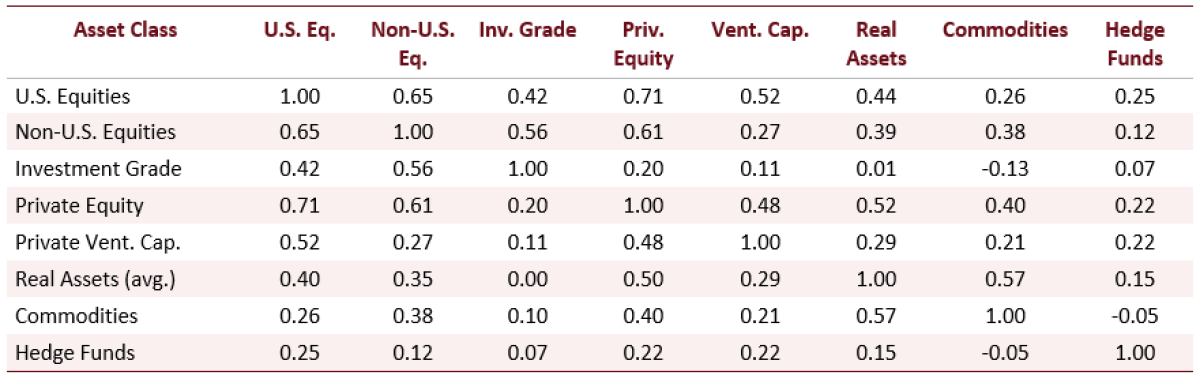
Table 3: Selected APT Correlation Estimates Across Asset Classes (APT Model)
(Image of Table 3 showing selected APT correlation estimates)
Note: Source: APT model, UMass Amherst Endowment Research Project (2026). Real Assets is an approximate composite based on several real asset sub-categories, so pairwise values should be interpreted as selected model estimates rather than a mathematically complete symmetric correlation matrix. Full model correlation output is available in the underlying workbook.
Private equity exhibits a correlation of 0.71 with U.S. equities, and venture capital shows a correlation of 0.52. Both asset classes retain a meaningful equity beta, indicating that their performance remains closely tied to the broader public equity markets. Similar exposures are observed in real estate and private energy investments. In contrast, hedge funds, as modeled by the Global HFR Index, demonstrate significantly lower correlations: 0.25 with U.S. equities and 0.12 with non-U.S. equities. Commodities even show a negative correlation of -0.05 with hedge funds.
This divergence is crucial: even with allocations exceeding 60% in alternatives, the equity factor remains the dominant driver of volatility for most large endowments, accounting for approximately 86% of ex-ante volatility. This implies that endowments have not necessarily eliminated equity risk but have, in many cases, shifted it towards manager selection, market timing expertise, and the acceptance of illiquidity.

Risk Profile: The Trade-off Between Higher Returns and Risk-Adjusted Efficiency
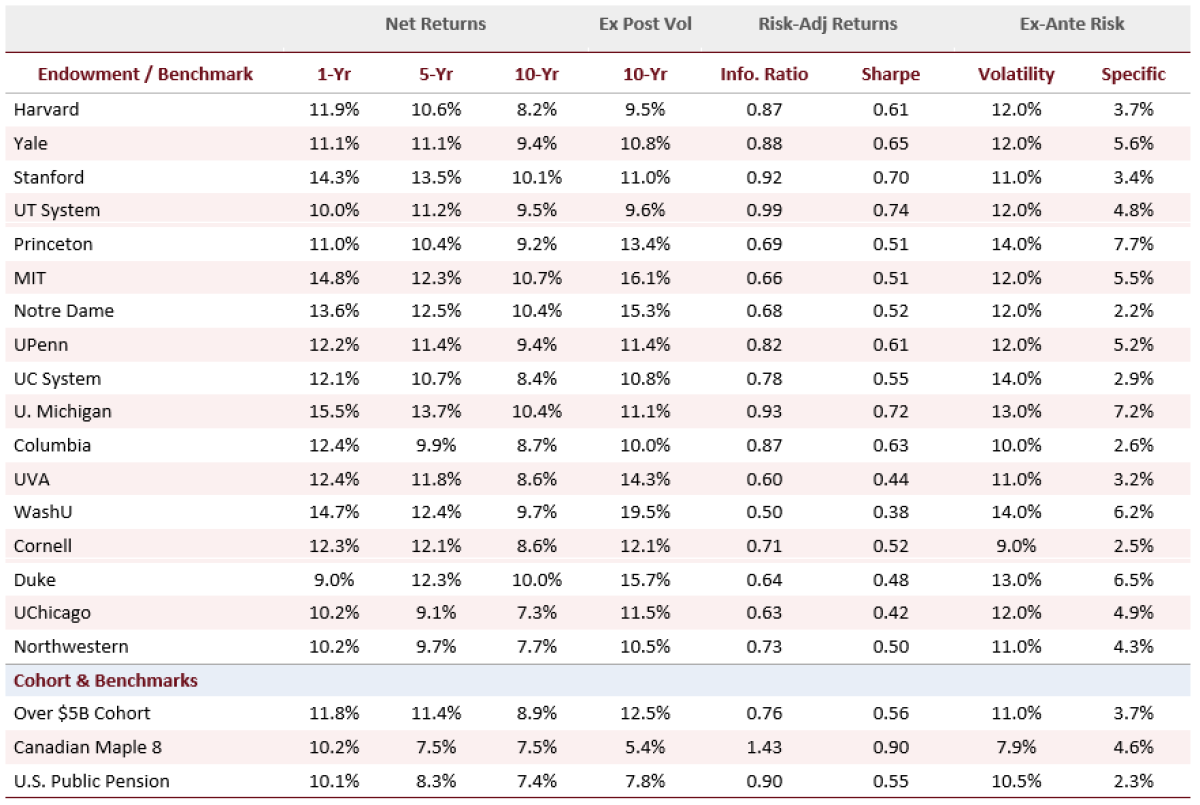
A comprehensive analysis of the FIS-APT risk model output reveals that while the largest U.S. endowments have outperformed their U.S. and Canadian pension fund peers over various time horizons—achieving annualized returns of approximately 12%, 11%, and 9% over one, five, and ten years respectively for the "Over $5B" cohort—this outperformance comes with higher ex-ante risk. The "Over $5B" cohort exhibits approximately 11% higher ex-ante risk, potentially leading to greater losses (around 20% in a 1-in-20-year event). Consequently, their risk-adjusted returns, measured by Sharpe and Information Ratios, lag behind their Canadian counterparts. The "Over $5B" cohort’s Sharpe Ratio is 0.56 and its Information Ratio is 0.76, whereas the Canadian Maple 8 achieves a Sharpe Ratio of 0.90 and an Information Ratio of 1.43.
Table 4: Ex-Ante Risk, Net Returns, and Risk-Adjusted Performance by Endowment Plan (APT Model Output)
(Image of Table 4 showing ex-ante risk, net returns, and risk-adjusted performance)
Note: Source: APT model output, UMass Amherst Endowment Research Project (2026). Net returns are from 2025 NACUBO-Commonfund Study and individual annual reports. Ex post volatility is 10-year realized. Sharpe Ratio uses the workbook’s 3.1% risk-free rate. Information Ratio is reported directly from the APT workbook. Ex-ante volatility and systematic/specific risk from the TLA_ST tab.
The range of Sharpe Ratios among the 17 endowments spans from 0.38 (WashU) to 0.74 (UT System), a stark contrast to the Maple 8’s 0.90. Washington University’s ten-year ex-post volatility of 19.5% is the highest among the group, which, despite a competitive 9.7% ten-year return, results in a lower Sharpe Ratio. Conversely, Cornell and Columbia demonstrate the lowest ex-ante volatility within the individual endowment group (9.1% and 9.6% respectively) and achieve above-average Sharpe Ratios relative to peers with higher headline returns. The Maple 8’s Information Ratio of 1.43 significantly surpasses the "Over $5B" cohort’s 0.76, clearly illustrating the efficiency gap. This suggests that while U.S. endowments are growing their assets, they are not necessarily doing so with the same level of risk-adjusted efficiency as some international peers.
Stress Testing: The Persistent Influence of Equity Risk
Despite extensive diversification into alternative assets, equity risk remains the dominant factor influencing endowment performance during market downturns. The FIS-APT model’s stress tests reveal that 86% of ex-ante volatility across large endowments is attributable to equity factor risk, leading to substantial losses in adverse scenarios.
Table 5: Potential Losses and Factor Risk Attribution by Endowment Plan (APT Model Output)
(Image of Table 5 showing potential losses and factor risk attribution)
Note: Source: APT model output, UMass Amherst Endowment Research Project (2026). VaR and Average Loss are 1-in-20-year annual loss estimates. Max Drawdown Horizon is 20 days. Factor attribution percentages are selected model factors and may not sum to 100% because Currencies and Other factor exposures are omitted for space. Stress test losses are scenario-based estimates: Financial Crisis (June-December 2008), COVID (March-April 2020), Stagflation (January-October 2022).
During the COVID-19 pandemic (March-April 2020), most endowments experienced losses ranging from 21% to 27%, a consequence of widespread equity beta that even alternative investments struggled to fully offset during this rapid global liquidity shock. However, in a hypothetical repeat of the early 2022 inflationary environment, endowments fared better than their pension fund benchmarks. The "Over $5B" cohort lost approximately 8%, while benchmark portfolios experienced losses of 22-25%. This resilience is attributed to the inflation-hedging properties of real assets and certain hedge fund strategies.
Several key observations emerge from these stress tests:
- Notre Dame’s Public Equity Exposure: Notre Dame exhibits the highest equity factor attribution at 96% and a significant stagflation loss of -18.1%, reflecting its heavier reliance on public equities.
- Duke’s Inflation Hedge: Duke’s commodities factor share of 11.7%, the highest in the peer group, contributed to a relatively smaller stagflation loss of -4.3%. Investments in real assets and natural resources provided a meaningful hedge against inflation.
- Maple 8’s Fixed Income Strategy: The Maple 8’s 7.0% duration factor attribution, significantly higher than most endowments’ negligible exposure, stems from its greater allocation to fixed income, often achieved through leverage. This strategy, while contributing to lower overall volatility, resulted in a -10.0% stagflation loss, worse than many endowments despite its more conservative volatility profile.
- UC System and Notre Dame’s Stagflation Vulnerability: The UC System and Notre Dame experienced the largest stagflation losses (-15.7% and -18.1% respectively), directly linked to their high equity factor concentrations (97.8% and 96.0%).
- U.S. Public Pension Funds’ Fixed Income Challenge: The U.S. Public Pension benchmark faced the largest stagflation loss (-18.8%) among benchmarks, consistent with mandatory fixed income allocations that become liabilities during periods of sharply rising interest rates.
Key Insights for Investment Professionals
This comprehensive analysis of top U.S. university endowments yields several critical insights for investment professionals navigating the complex landscape of institutional asset management:
-
Raw Returns Demand Volatility Adjustment: When comparing endowment performance, it is imperative to adjust raw returns by their associated volatility. For instance, WashU’s ten-year return of 9.7% and Cornell’s 8.6% appear similar in isolation. However, WashU’s ex-ante volatility of 14.1% contrasts sharply with Cornell’s 9.1%. Cornell’s more disciplined approach yields a more efficient outcome on a risk-adjusted basis, as clearly illustrated by the Sharpe Ratios in Table 4.
-
Factor Attribution as a Stress-Test Explainer: Understanding factor attribution offers a more profound insight into stress-test outcomes than simply examining allocation labels. Endowments with similar allocations to alternatives can exhibit vastly different equity factor shares, which is the primary determinant of losses during financial crises and the COVID-19 pandemic. Differentiated stagflation outcomes in 2022 were largely driven by exposures to real assets and commodities, specifically in energy, natural resources, and infrastructure.
-
Structural Differences in the Maple 8 Approach: The success of the Maple 8 is not merely a strategic choice but a reflection of a structurally different approach. U.S. endowments primarily use real assets and hedge funds to diversify away from public equities. In contrast, the Maple 8 employs leverage—derived from debt, repo, and derivatives markets—to diversify exposures, particularly into fixed income. While both strategies aim to enhance risk-adjusted returns compared to traditional portfolios, they achieve this through different mechanisms with distinct risk profiles. The Maple 8’s superior Sharpe Ratio (0.90) and Information Ratio (1.43) compared to the largest U.S. endowment cohort (0.56 and 0.76, respectively) suggest that closing this efficiency gap would necessitate U.S. endowments adopting balance sheet leverage and direct investment infrastructure, which may be hindered by current governance structures and regulatory frameworks.
The sustained growth of university endowments underscores their vital role in supporting academic institutions. However, this analysis highlights the ongoing challenge for these endowments to balance aggressive growth objectives with prudent risk management and to continuously refine their strategies to achieve optimal risk-adjusted returns in an evolving global financial landscape. The insights gleaned from these top institutions provide a valuable roadmap for fiduciaries and investment committees seeking to enhance portfolio resilience and long-term value.
