

Stephen F. O’Byrne, President and Co-founder of Shareholder Value Advisors Inc., presents a compelling analysis in a recent memorandum, challenging conventional wisdom in corporate director compensation. The core argument posits that the long-held objectives of director pay—incentivizing shareholder value, retaining talent, and managing costs—are not being effectively met by current practices, particularly the increasing reliance on equity-based compensation.
The Conventional Wisdom and Its Limitations
For decades, the prevailing strategy in executive and, subsequently, director compensation has centered on a dual approach: setting target pay at the median of peer companies and ensuring a significant portion of that pay is “at risk.” The theory is straightforward: aligning pay with market medians retains essential talent, while a substantial portion of pay being contingent on performance provides a strong incentive for value creation, all while controlling overall costs by capping pay above the median. This framework has become deeply entrenched in how boards of directors are compensated.
However, O’Byrne’s research, stemming from Shareholder Value Advisors’ in-depth memorandum, suggests this conventional approach, while seemingly logical, may be fundamentally flawed. The increasing allocation of director pay towards equity—primarily stock and stock options—has led to a significant shift in how directors are incentivized. While intuitively, a higher percentage of pay in stock should translate to a stronger alignment with shareholder interests, the reality appears far more complex and, in many cases, less effective than assumed.
The Ascent of Equity-Based Director Pay
The data paints a clear picture of this shift. For directors within the U.S. S&P 1500 companies, the proportion of compensation delivered in equity has surged dramatically over the past three decades. In 1997, equity constituted a mere 27% of director pay. By 2025, this figure had climbed to an average of 59%. This significant increase has also been accompanied by a notable reduction in the variability of this percentage, suggesting a more uniform adoption of equity-heavy pay packages across the board.
Furthermore, director compensation levels have increasingly converged around market benchmarks. This convergence is typically measured by comparing director pay to that of their peers in companies of similar revenue size within the same industry. The standard deviation of the log difference from market pay for U.S. S&P 1500 directors has shrunk from 0.70 in 2002 to 0.31 in 2024, indicating a tighter clustering of compensation around industry averages.
Deconstructing Pay Leverage: Beyond the Equity Percentage
The expectation, based on these trends, would be a robust and consistent alignment of director incentives with shareholder value. The logic suggests that if a director holds a substantial portion of their personal wealth in company stock, any increase in shareholder wealth should proportionally impact their own financial well-being. For instance, if 60% of a director’s wealth is tied up in company stock, a 1% increase in shareholder wealth would theoretically lead to a 0.6% increase in the director’s wealth. This multiplier effect is termed "wealth leverage."

However, a critical distinction emerges: the assumption that a high percentage of pay in equity directly translates to a comparable level of wealth leverage is misleading. Directors and compensation committees often equate 60% of pay in stock with a 0.6 wealth leverage. In reality, the actual incentive provided by these pay structures is far more variable and often significantly weaker than anticipated.
Measuring the True Incentive: Pay Leverage Defined
To accurately assess the incentive power of director pay plans, Shareholder Value Advisors introduces the concept of "pay leverage." This metric quantifies the sensitivity of a director’s cumulative pay value to the company’s cumulative total shareholder return (TSR). It is calculated as the ratio of the percentage change in cumulative pay—measured on a "mark-to-market" basis at year-end—to the percentage change in cumulative shareholder wealth.
A series of empirical tests were conducted using data from over 20,000 directors across S&P 1500 companies. These directors had between 55% and 65% of their pay allocated to equity over five-year periods ending between 2011 and 2025. The findings were stark. While the intuition suggests a pay leverage close to the percentage of equity in pay (around 0.6 in this case), the reality was a wide dispersion. A significant portion of directors (10%) exhibited pay leverage below negative 0.11, meaning their pay decreased as shareholder wealth increased. Another 25% had pay leverage below 0.17. The median pay leverage across this group was a mere 0.41, substantially lower than the expected 0.6. Conversely, a substantial segment of directors (25%) demonstrated pay leverage above 0.66, and 10% even exceeded 1.0, indicating a strong, sometimes disproportionate, sensitivity of their pay to shareholder returns.
Contrasting Real-World Scenarios: Amy Chang and Gay Evans
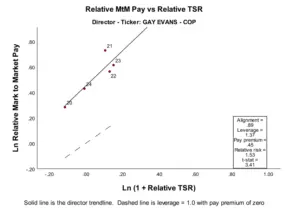
Illustrative examples highlight the disconnect between equity allocation and actual pay leverage. Amy Chang, a director at Procter & Gamble, and Gay Evans, a director at ConocoPhillips, both had average equity allocations in the 60-63% range over a five-year period (2020-2024). Yet, their pay leverage figures were dramatically different from expectations and from each other.
Chang’s pay leverage was a negative 0.83, signifying that her compensation tended to decrease as Procter & Gamble’s shareholder wealth grew. This suggests a misalignment where her financial interests moved in opposition to those of shareholders. In contrast, Evans exhibited a pay leverage of 1.37, indicating that her compensation increased at a faster rate than shareholder wealth. While this suggests a strong incentive, the magnitude might point to potential over-incentivization or structural issues.
The analysis behind these figures involves tracking cumulative "mark-to-market" pay against cumulative TSR. Cumulative pay for a given year includes the sum of annual cash retainers and the year-end valuation of stock awards received since 2020. To isolate the incentive tied to company performance rather than broader market or industry trends, TSR is adjusted for industry performance, and director pay is adjusted for market pay, defined as the average compensation for directors in comparable companies. This rigorous adjustment process allows for a more accurate assessment of how a director’s pay truly responds to their company’s specific performance relative to its peers.
The Root Causes of Misaligned Incentives
The significant divergence in pay leverage, as seen in the cases of Chang and Evans, points to systemic issues within conventional compensation structures. Research by Shareholder Value Advisors suggests that a simplified pay plan, featuring annual grants of performance shares, could achieve a pay leverage of 1.0 with perfect pay alignment. This ideal structure deviates from current practices in four key areas:

- 100% Equity Allocation: The idealized plan allocates the entirety of compensation to stock, maximizing the direct link between pay and stock performance.
- Performance-Adjusted Target Pay: Instead of setting target pay at the market median regardless of past performance, this model adjusts target pay based on historical performance. This prevents a "performance penalty" where high stock returns lead to reduced grant sizes to stay within target, and poor returns lead to increased grants to meet the target, thereby diluting the incentive for sustained performance.
- Industry-Neutral Vesting: Stock vesting is designed to strip out the impact of industry-wide returns. The vesting multiple is calculated as 1 / (1 + industry return), ensuring that the director’s reward is based on the company’s outperformance relative to its sector, not just general industry growth.
- Deferred Cash as Equity Draw: Any cash distributed before the end of the performance period is treated as an advance against the value of performance shares. This effectively means all equity is held for the entire measurement period, typically five years, before vesting.
The study posits that even a partial adoption of these principles, such as incorporating a cash retainer equal to 40% of the initial stock grant value alongside equity compensation structured according to the "perfect correlation pay plan," would significantly narrow the range of director pay leverage and alignment, bringing it closer to the desired performance-linked outcomes.
Simulating an Enhanced Compensation Model
To quantify the impact of these proposed improvements, Shareholder Value Advisors conducted simulations using data from over 100,000 director five-year periods. The results are compelling. Under the simulated improved model, director pay leverage is projected to stabilize at a median of 0.60, with the 10th percentile at 0.47 and the 90th percentile at 0.70. This represents a much tighter and more predictable range compared to the current highly variable outcomes.
Crucially, pay alignment, a measure of how well director pay tracks relative TSR, is projected to remain at 0.98 or higher for nearly all directors, indicating a strong and consistent connection between compensation and company performance. Under this model, Amy Chang’s pay leverage would shift to 0.65 with perfect alignment (1.00), and Gay Evans’ would adjust to 0.60 with perfect alignment (1.00). These simulated figures demonstrate how structural changes can bring compensation more in line with intended incentive objectives.
The Imperative to Rethink Director Compensation
The current landscape of director compensation, characterized by a near-universal embrace of the "high percent of pay at risk" coupled with median target pay, has demonstrably failed to achieve its stated objectives for many companies. The overemphasis on the percentage of pay delivered in equity has obscured a more fundamental issue: the actual pay leverage and alignment experienced by directors.
The research from Shareholder Value Advisors strongly suggests that two primary policy failures contribute to this misalignment: the practice of setting target pay at market levels irrespective of past company performance, and the failure to adequately neutralize the impact of industry-wide stock returns on director equity awards. These practices inadvertently penalize strong past performance and reward subpar performance, thus weakening the incentive to drive superior shareholder returns.
For directors, compensation consultants, proxy advisory firms, and institutional investors, a paradigm shift in focus is urgently needed. The conversation must move beyond the superficial metric of "percent of pay in equity" to a deeper examination of "pay leverage" and "pay alignment." By adopting more sophisticated compensation structures that genuinely link director pay to sustainable, company-specific value creation, boards can more effectively fulfill their fiduciary duty to shareholders and ensure that their leadership is truly incentivized to drive long-term success. The implications of this shift extend to corporate governance, potentially leading to more engaged and performance-driven boards, which in turn can foster greater investor confidence and improved corporate outcomes.
