
Washington D.C. – May 1, 2026 – A striking economic divergence is unfolding at the gas pump, with lower-income households bearing the brunt of escalating fuel costs by significantly curtailing their consumption, while their higher-income counterparts have largely maintained their driving habits despite the soaring prices. This "K-shaped" pattern, a term that has become synonymous with the unequal economic recovery following the COVID-19 pandemic, was starkly highlighted in new research released by the Federal Reserve Bank of New York on Wednesday.
The report, published via a blog post on Liberty Street Economics, reveals that during the significant energy price spike experienced in March 2026, households earning less than $40,000 annually increased their nominal spending on gasoline by a mere 12%. This modest rise in expenditure was not due to increased driving, but rather a substantial reduction in consumption, which fell by 7% for this demographic. The findings underscore a profound struggle for those at the lower end of the economic spectrum to absorb rising costs.
In stark contrast, households with incomes exceeding $125,000 per year saw their nominal gasoline spending jump by 19% during the same March period. Crucially, their actual consumption of gasoline decreased by only 1%, indicating a much greater capacity to absorb the higher prices without altering their driving patterns.
"Thus, the K-shaped consumption pattern in both nominal and real gasoline spending was strongly evident in March 2026," the New York Fed researchers, Rajashri Chakrabarti, Thu Pham, Beck Pierce, and Maxim Pinkovskiy, stated in their analysis.
The Widening Chasm: A "K-Shaped" Economic Reality
The concept of a "K-shaped economy" gained prominence in the post-COVID era, describing a scenario where different segments of the population experience vastly different economic trajectories. Economists have observed that while wealthier individuals and households have benefited from robust growth in asset values – such as stocks and real estate – those with lower incomes have seen far more limited gains, and in many cases, have faced declining real incomes.
This disparity has been exacerbated by persistent inflation. Consumer prices have surged approximately 28% since March 2020, the month the World Health Organization declared COVID-19 a global pandemic. Over the same period, average hourly earnings have seen a growth of only 30%, effectively meaning that real wages, after accounting for inflation, have remained largely stagnant for many workers.
Federal Reserve Chair Jerome Powell has repeatedly acknowledged the disproportionate impact of this inflationary environment on those least able to afford higher prices. The central bank’s target inflation rate of 2% has been consistently exceeded for the past five years, creating a challenging economic landscape for a significant portion of the population.

The Energy Shock: Fueling the Divide
The latest research from the New York Fed zeroes in on the energy sector as a key arena where these K-shaped economic impacts are acutely felt. Energy prices, in general, have climbed a staggering 56% in the post-pandemic economy. The March 2026 energy price shock, triggered in part by the escalating conflict in the Middle East and its implications for global oil supply, further intensified this trend.
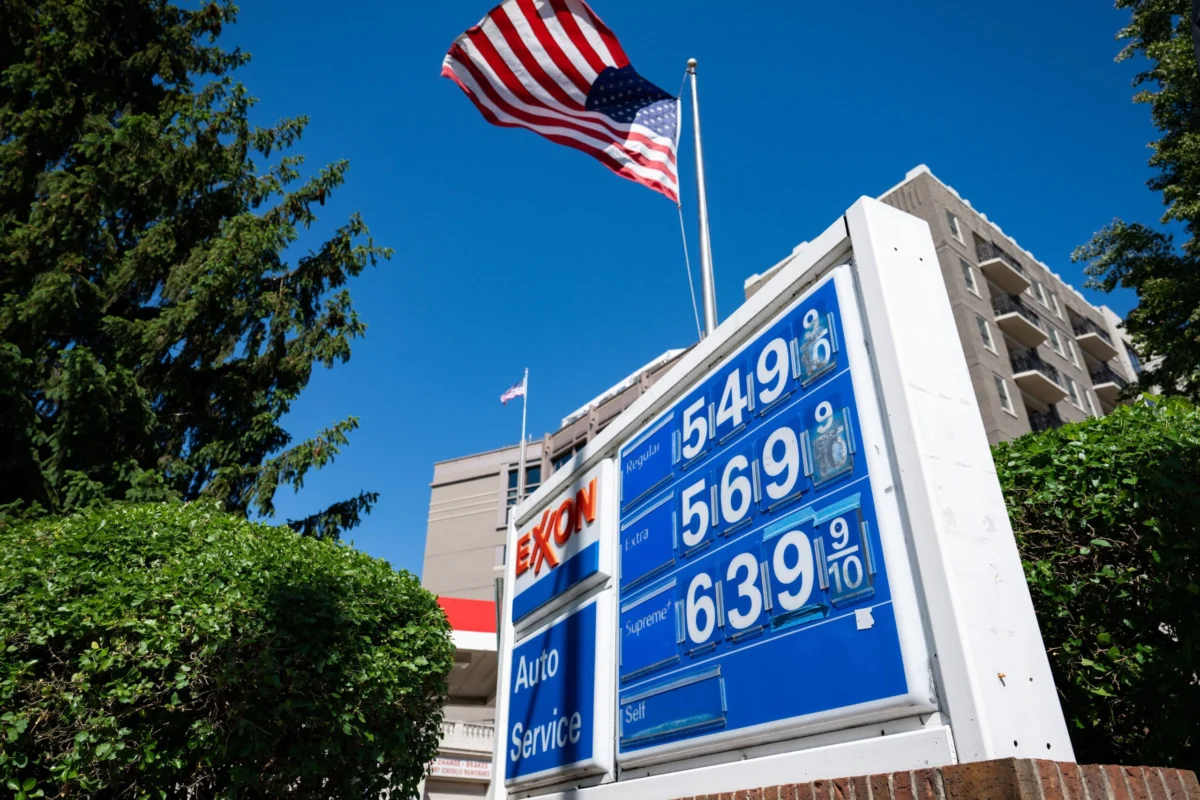
According to data from the Energy Information Administration (EIA), the average price of gasoline surged by nearly a dollar a gallon in March 2026, reaching an average of $3.81. By May 1, 2026, this figure had climbed further to $4.30 per gallon. This dramatic increase at the pump serves as a tangible and immediate financial burden for millions of Americans.
"With the current energy price shock, a K-shaped pattern in gasoline consumption has opened up much more than before," the New York Fed paper elaborated.
The researchers further detailed the behavioral adjustments: "Higher-income households have reduced real gas consumption only modestly and increased gasoline spending considerably compared with 2023. In contrast, lower-income households increased spending by much less and decreased real consumption by much more, potentially by carpooling or substituting to public transit where available."
Historical Parallels and Amplified Disparities
This pattern of disparate impacts during energy price spikes is not entirely new. The study noted that the direction of this trend is similar to the energy shock experienced in 2022 following Russia’s invasion of Ukraine. However, the researchers emphasized that "the gap in consumption trends during the current episode is quantitatively larger," indicating a deepening of the economic divide.
The study’s methodology involved a panel of 2,000 respondents, providing a robust dataset for their analysis. The overall increase in gasoline spending across all income brackets in March was reported to be 15%, a figure that masks the significant differences in how various income groups contributed to and absorbed this rise.
A Deeper Dive into the Data
To further contextualize these findings, an examination of broader economic indicators provides crucial background.
Timeline of Key Economic Events:

- March 2020: The World Health Organization declares COVID-19 a global pandemic. The U.S. economy enters a period of unprecedented disruption, with widespread lockdowns and a sharp economic contraction.
- 2020-2021: A period of significant fiscal stimulus and monetary easing by governments and central banks globally. This was intended to cushion the economic blow and foster recovery. Asset markets, particularly equities and real estate, begin a rapid ascent.
- Late 2021 – Early 2022: Inflationary pressures begin to build due to supply chain disruptions, strong consumer demand fueled by stimulus, and the war in Ukraine.
- February 2022: Russia invades Ukraine, leading to significant disruptions in global energy and food markets, further fueling inflation.
- 2022-2025: Inflation remains stubbornly high, prompting central banks, including the Federal Reserve, to implement a series of interest rate hikes to cool the economy. This period also sees a divergence in economic fortunes, with the wealthy often benefiting from rising asset prices while many lower- and middle-income households struggle with rising costs of living.
- Early 2026: Escalating geopolitical tensions in the Middle East lead to a sharp increase in oil prices, impacting gasoline costs globally. This event acts as a catalyst for the pronounced K-shaped divergence observed in the New York Fed’s latest study.
Supporting Data and Context:
- Inflation Rates: The Consumer Price Index (CPI) has shown a consistent upward trend. While the exact figures fluctuate, the overall trajectory since early 2020 has been significantly above the Federal Reserve’s target. For instance, annual inflation rates have hovered between 4% and 8% for extended periods in the post-pandemic era, with significant spikes in energy and food categories.
- Wage Growth vs. Inflation: The gap between nominal wage growth and inflation is a critical factor. While average hourly earnings have seen some increases, they have often lagged behind the rate of price increases for essential goods and services. This means that the purchasing power of many households has eroded.
- Asset Appreciation: The S&P 500, a broad measure of U.S. stock market performance, has experienced substantial gains since early 2020, driven by technological innovation, accommodative monetary policy, and strong corporate earnings in certain sectors. Similarly, housing prices in many regions have seen significant appreciation, benefiting property owners.
- Energy Price Volatility: The EIA data reveals a dramatic increase in the price of West Texas Intermediate (WTI) and Brent crude oil, the benchmarks for global oil prices. This volatility directly translates to higher prices at the pump for consumers. The conflict in the Middle East has introduced a significant risk premium into oil prices, contributing to the recent surge.
Implications and Broader Economic Impact
The findings from the New York Fed research have significant implications for economic policy and social equity.
For Policymakers: The K-shaped recovery necessitates a nuanced policy response. While interest rate hikes by the Federal Reserve are aimed at curbing inflation, they can also put further strain on lower-income households. Policymakers may need to consider targeted support measures for vulnerable populations, such as energy assistance programs or measures to bolster wage growth.
For Consumers: The behavioral changes observed highlight the difficult choices facing lower-income households. Reducing essential travel, carpooling, or relying on public transportation, where feasible, are survival strategies. For higher-income households, the ability to absorb price increases suggests a greater resilience to economic shocks.
For the Economy: Persistent K-shaped trends can lead to increased income inequality, reduced aggregate demand (as lower-income consumers cut back on spending), and potential social unrest. The long-term economic health of a nation is often tied to the well-being of its broader population, not just its wealthiest segments.
Potential Reactions from Related Parties (Inferred):
- Consumer Advocacy Groups: Likely to express deep concern over the findings, calling for immediate government intervention to alleviate the burden on low-income families. They may advocate for price caps on essential goods or increased social safety nets.
- Energy Industry: May point to global supply and demand dynamics, geopolitical factors, and the transition to renewable energy as drivers of price fluctuations, while potentially downplaying the disproportionate impact on specific income groups.
- Economists and Academics: Will likely use this research to further debate the effectiveness of current economic policies and the sustainability of a K-shaped recovery. Discussions may center on fiscal versus monetary policy tools and the need for structural economic reforms.
The stark reality at the gas station, as illuminated by the Federal Reserve Bank of New York’s research, is a powerful indicator of a widening economic chasm. The "K-shaped" recovery is not merely an abstract economic concept; it is a lived experience that dictates how millions of Americans navigate their daily lives and make ends meet in an era of persistent inflation and volatile energy prices. The continued analysis of these trends will be crucial for understanding the long-term trajectory of the U.S. economy and the well-being of its diverse population.
