

New data from a comprehensive 2026-2027 survey of 1,551 U.S. private companies reveals significant disparities in chief executive officer compensation across industries. Financial services and biotechnology sectors are projected to offer the highest median cash compensation for CEOs in 2026, while sectors like education, government, nonprofit organizations, and retail are experiencing downward pressure on executive pay. The analysis, conducted by Chief Executive Group Research, underscores the critical interplay between industry, company size, and revenue in determining executive remuneration, highlighting that while sector averages provide a baseline, granular benchmarking is essential for accurate compensation strategies.
Shifting Landscape of CEO Compensation
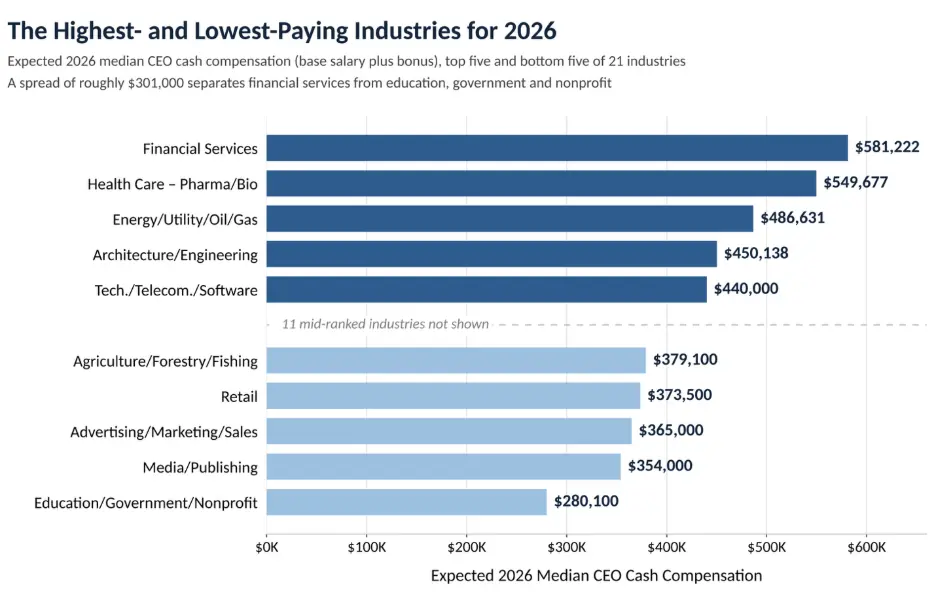
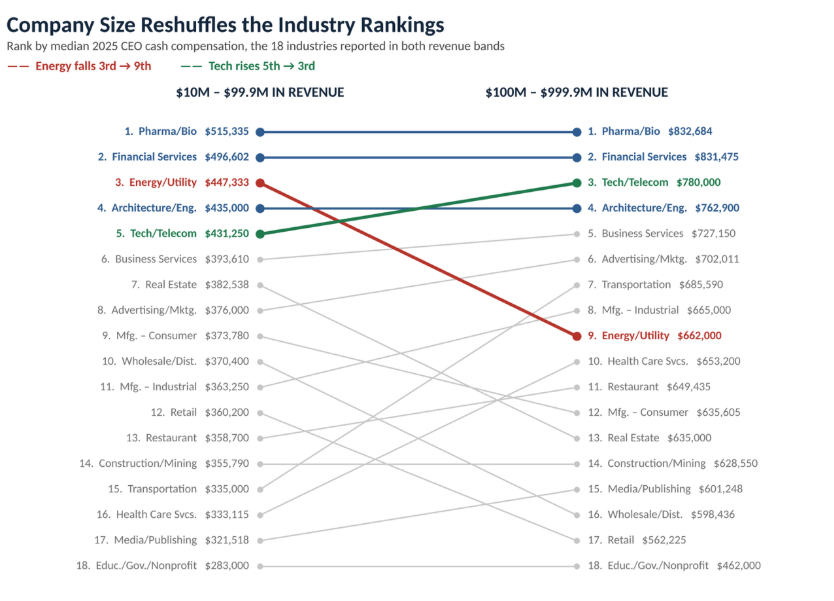
The landscape of executive compensation in private companies is far from uniform. While company size remains a dominant factor, the industry in which a company operates exerts a substantial influence on the remuneration packages offered to its chief executive. The latest findings project that CEOs in the financial services sector will command the highest median cash compensation in 2026, estimated at $581,222. This figure significantly outpaces the projected $280,100 for leaders in education, government, and nonprofit organizations, which occupy the lowest rungs of the compensation ladder. However, a deeper dive into the data reveals more nuanced trends and significant shifts that complicate a simple industry-based assessment.
Top-Tier Sectors Commanding Highest CEO Pay
The financial services sector is poised to lead in CEO compensation in 2026, with an anticipated median cash payout of $581,222. This includes a base salary of $418,722 and a bonus component of $162,500. Following closely are the pharmaceutical and biotechnology sectors, where CEOs are expected to receive a median compensation of $549,677. The energy, utilities, oil, and gas industry ranks third, with projected CEO earnings of $486,631. Rounding out the top five highest-paying industries are architecture and engineering ($450,138) and technology, telecommunications, and software ($440,000).
Lower-Paying Sectors and Significant Compensation Gaps
At the opposite end of the spectrum, CEOs in education, government, and nonprofit organizations are expected to earn a median cash compensation of $280,100. Media and publishing follow, with projected earnings of $354,000. The advertising, marketing, and sales sector anticipates median compensation of $365,000, while retail is projected at $373,500. Agriculture, forestry, and fishing complete the bottom five, with an expected median compensation of $379,100. This creates a substantial gap of approximately $300,000 between the highest- and lowest-paying sectors, illustrating the significant economic stratification in executive pay across different industries.
The Peril of Oversimplified Industry Benchmarking
The pronounced differences in CEO compensation across industries are not entirely unexpected. Each sector operates with unique business models, varying levels of profitability, and distinct financial resources available for executive remuneration. A financial services firm, for instance, often has a vastly different compensation structure compared to a nonprofit organization, even when both are led by highly experienced executives. This fundamental divergence underscores the limitations of relying solely on industry averages.
This is why industry-specific data is most impactful when contextualized with other critical benchmarks, such as company revenue, ownership structure, and profitability metrics. Without this broader perspective, industry-wide compensation figures can be misleading, failing to capture the diverse realities within sectors.
Impact of Company Size on Compensation
Actual compensation data from 2025 provides a clearer picture when segmented by company revenue. Among companies generating between $10 million and $99.9 million in annual revenue, CEOs in the pharmaceutical and biotechnology sectors earned the highest median cash compensation at $515,335. Financial services followed at $496,602, with energy at $447,333 and architecture and engineering at $435,000. Notably, technology CEOs in this revenue bracket earned a median of $431,250, placing them close to the leading sectors, despite ranking fifth in the overall 2026 forecasts.
The compensation landscape shifts again for larger companies. Within the $100 million to $999.9 million revenue band, pharmaceutical/biotech and financial services are nearly tied for the lead, with median CEO cash compensation of $832,684 and $831,475, respectively. In this segment, technology advances to third place among the represented industries, with compensation at $780,000, followed by architecture and engineering at $762,900. Intriguingly, the energy sector, which ranks third overall in the 2026 forecast, falls to $662,000 in this revenue band, underscoring how company size can significantly alter sector rankings.
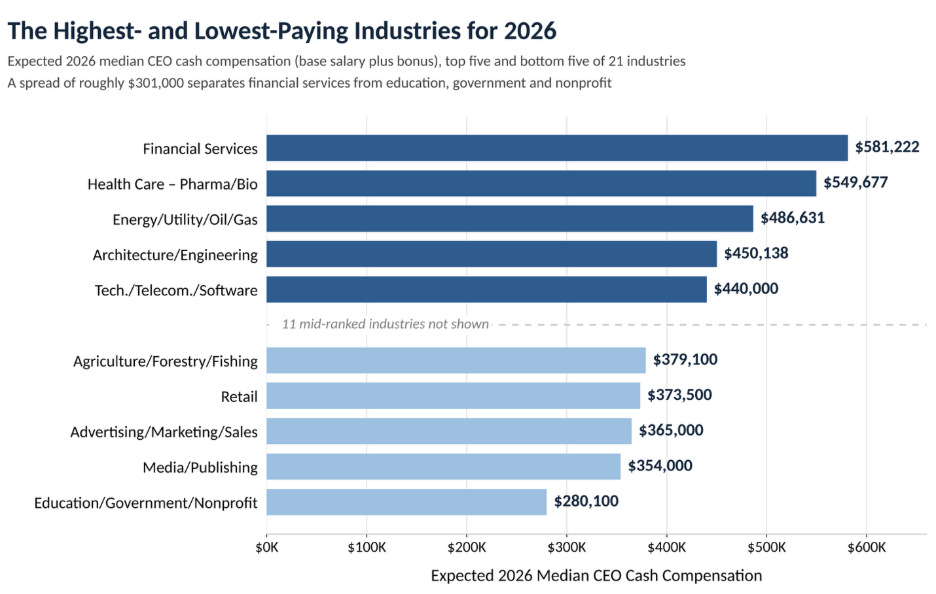
These findings highlight a crucial lesson for companies benchmarking CEO pay: while industry is a significant factor, company size and revenue are at least equally important determinants of executive compensation. A sector dominated by larger corporations may report higher overall executive pay, even if CEOs at similarly sized businesses in other industries earn comparable or greater amounts.
Underlying Drivers of Sectoral Pay Differences
The disparities in CEO compensation across industries are intrinsically linked to how companies generate value and the unique demands placed upon their leadership.
Financial Services: Capital Management and Risk
Financial services companies operate in environments where sophisticated capital management, stringent regulatory compliance, intricate risk assessment, and strategic investment decisions are paramount to success. These complexities often translate into higher compensation packages. Furthermore, the financial services sector offers the most substantial bonus opportunities in absolute dollar terms. In 2026, financial services CEOs anticipate the largest median bonuses, at $162,500. When viewed as a percentage of base salary, however, architecture and engineering leads, with bonuses averaging 50.2% of base pay, indicating a different emphasis on variable compensation structures.
Biotech and Pharma: Innovation and Long Development Cycles
Pharmaceutical and biotechnology companies face a distinct set of challenges, including lengthy product development cycles, inherent scientific uncertainties, complex regulatory approval processes, and substantial research and development investments. These factors demand exceptional leadership with specialized expertise, justifying higher executive compensation. The sector’s projected median CEO bonus of $150,000 in 2026 places it second only to financial services, reflecting the high stakes and potential rewards associated with groundbreaking innovation.
Technology: Navigating Rapid Change
Technology companies typically place a premium on leaders capable of steering through constant innovation, adapting to evolving business models, and managing intense competitive pressures. The sector’s stronger performance in company-size comparisons suggests that its overall industry ranking may not fully encapsulate its compensation competitiveness, particularly for firms operating at scale. The ability to foster innovation and respond agilely to market shifts is a critical leadership attribute that commands significant financial recognition.
Non-Profits and Public Sectors: Mission-Driven Constraints
Conversely, education, government, and nonprofit organizations operate under fundamentally different financial and governance frameworks. Compensation decisions in these sectors are often influenced by mission objectives, diverse funding sources, and public or stakeholder scrutiny, which differ considerably from the market-driven dynamics of commercial enterprises. This often results in more constrained compensation structures.
Retail and Consumer-Facing Industries: Margin Pressures
Retail and other consumer-facing businesses contend with their own set of pressures, including fluctuating labor costs, tight operating margins, and demand volatility. These economic realities can limit the resources available for executive incentives, contributing to lower compensation levels compared to other sectors.
Historical Trends and Sectoral Performance
A historical perspective on CEO compensation provides valuable insights into industry dynamics and the evolution of executive pay.
Top Performers: Financial Services and Biotech Trajectories
Financial services has consistently ranked at the top of compensation surveys over the past three years, though its projected pay has experienced fluctuations. In 2024, financial services CEOs forecasted median cash compensation of $597,500. This figure dipped to $540,265 in 2025 before rebounding to the projected $581,222 for 2026.
The pharmaceutical and biotechnology sectors have followed a similar, albeit more pronounced, trajectory. Expected compensation fell from $532,312 in 2024 to $476,517 in 2025, then surged to an anticipated $549,677 in 2026. A significant portion of this recent rebound in biotech and pharma is attributed to increased bonuses. CEOs in these sectors expect a median bonus of $150,000 in 2026, a substantial increase from the $90,000 projected in 2025, while base salaries have seen more modest growth. This pattern aligns with a sector where compensation opportunities are closely tied to business performance and future expectations.
Energy Sector Stability
The energy, utilities, oil, and gas sector presents a different narrative, with expected CEO cash compensation remaining remarkably stable over the three-year period: $485,256 in 2024, $491,616 in 2025, and $486,631 in 2026. While the sector continues to be among the highest-paying overall, its consistent compensation levels contrast with the more dynamic movements observed in financial services and biotechnology.
Consistent Low Performers
At the lower end of the spectrum, education, government, and nonprofit organizations have demonstrated striking consistency in their compensation figures, moving from $275,850 in 2024 to $278,600 in 2025, and projecting $280,100 for 2026. Media and publishing has also remained relatively static near the bottom, with expected compensation hovering between $350,510 and $359,250 across the same period.
Retail’s Decline Amidst Industrial Recovery
Among commercial industries, retail stands out for its downward trend. Retail CEOs anticipated median cash compensation of $411,695 in 2024, which declined to $406,672 in 2025 and is projected to further decrease to $373,500 in 2026. A significant driver of this decline is the reduction in bonuses, which are expected to fall from $117,632 in the 2024 forecast to $75,000 in 2026, while base salaries have remained relatively stable. This suggests that variable pay in the retail sector is more closely linked to financial performance and market conditions.
In contrast, wholesale and distribution has shown a positive recovery. After experiencing a dip from $433,400 in 2024 to $383,933 in 2025, the 2026 forecast projects a rebound to $423,338. Industrial manufacturing also exhibits a similar recovery pattern, following a decline from $408,000 in 2024 to $390,000 in 2025, with a projected increase to $412,500 for 2026. Consumer-goods manufacturing has remained relatively steady, with projected compensation of $431,500 in 2026, compared to $423,500 in 2024. These movements may reflect shifts in economic conditions, evolving compensation expectations, or changes in the composition of survey respondents year-over-year, serving as important indicators for future trends.
Key Takeaways for Compensation Strategy in 2027 and Beyond
The comprehensive analysis of CEO compensation trends offers several critical insights for boards of directors and companies when reviewing and setting executive remuneration for 2027 and beyond:
- Contextualize Industry Averages: While industry classifications provide a useful starting point, they should not be the sole basis for compensation decisions. The significant variations within industries, driven by company size, revenue, and specific business models, necessitate a more granular approach.
- Prioritize Company-Specific Benchmarking: The data strongly suggests that company size and revenue are paramount. Compensation strategies must be tailored to the company’s specific financial scale and operational complexity, using benchmarks that accurately reflect these factors.
- Understand Sectoral Dynamics and Value Creation: Different industries face distinct challenges and opportunities that shape compensation structures. Financial services and biotech, for example, reward roles that manage significant capital and innovation risks, while sectors with tight margins or public oversight may have more constrained pay scales. Analyzing how a company generates value and the demands on its leadership is crucial for setting appropriate pay.
The lesson for companies is not to dismiss industry comparisons but to employ them with greater sophistication and analytical rigor. A holistic approach, integrating industry data with company-specific metrics like revenue, ownership structure, and profitability, will enable more effective and competitive compensation strategies. For more in-depth benchmarking across company size, industry, and ownership structures, Chief Executive Group Research’s latest CEO & Senior Executive Compensation Report provides detailed insights.
