

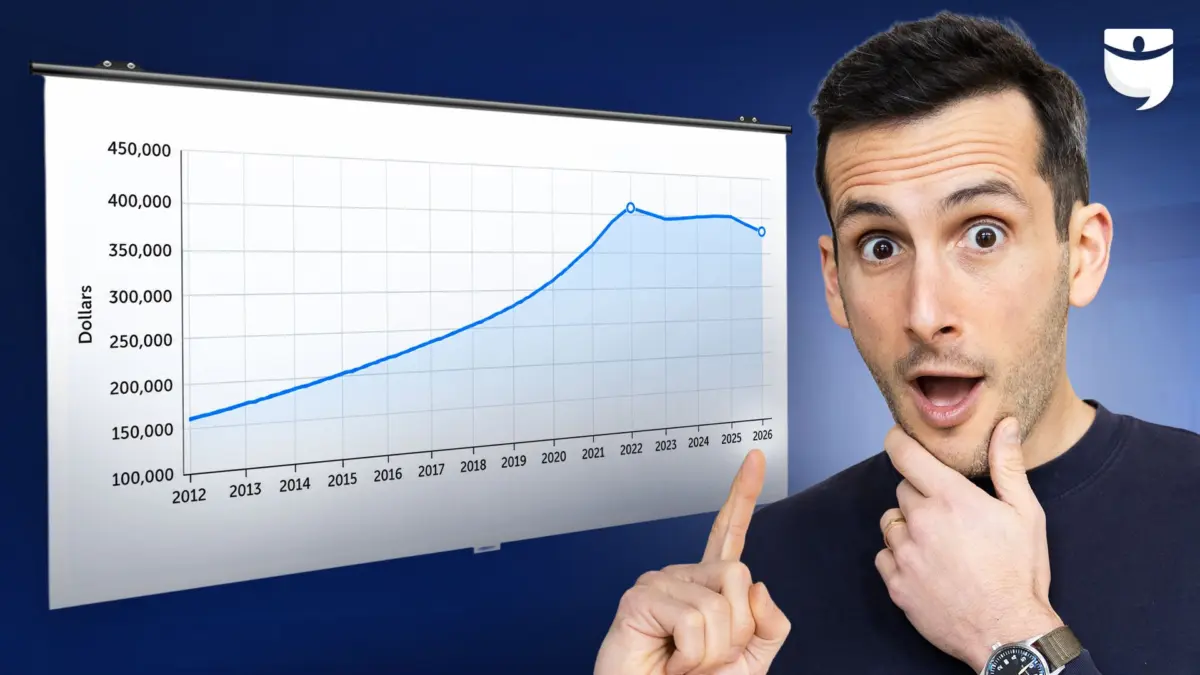
The United States housing market has reached a significant inflection point as year-over-year home price growth turned negative in October, effectively ending a nearly 13-year streak of uninterrupted appreciation. According to data released in the latest market reports, the median sale price for a U.S. home fell to $388,600, representing a 0.4% decline compared to the same period last year. While the magnitude of the drop is modest, economists and market analysts view this shift as a definitive signal that the long-anticipated market correction has transitioned from a slowdown in growth to an absolute reduction in value.
This development marks the first time since 2012 that prices have sustained a downward trajectory on an annual basis, discounting a brief and isolated fluctuation in mid-2023. The shift comes as a convergence of high mortgage rates, persistent inflation, and a growing disconnect between seller expectations and buyer affordability creates a "stalemate" environment. For the first time in the post-pandemic era, the leverage has shifted measurably toward the buyer, though high borrowing costs continue to limit the number of participants capable of taking advantage of the cooling prices.
A Chronology of the Market Correction
The path to negative price growth began in early 2022, when the Federal Reserve initiated an aggressive interest rate hiking cycle to combat soaring inflation. Prior to this, the market had experienced a historic boom fueled by sub-3% mortgage rates and a pandemic-driven shift in housing preferences. By the end of 2022, the rapid ascent of borrowing costs had begun to stifle transaction volumes, yet home prices remained stubbornly high due to a severe shortage of inventory.
Throughout 2023 and the first half of 2024, the market entered what many analysts termed "The Great Stall." Sellers, many of whom were locked into ultra-low mortgage rates, were reluctant to list their properties, while buyers were sidelined by a combination of high prices and 7% interest rates. This "lock-in effect" kept supply low enough to support price levels despite cratering demand. However, by August 2024, the pressure began to yield. Annual price growth, which stood at 2.5% in late summer, began a rapid descent, culminating in the negative 0.4% print for October.
Analysts suggest that November data will likely show a further acceleration of this trend, with projections indicating a potential 1% year-over-year decline. This trajectory aligns with broader economic forecasts that predicted a correction range of -4% to +2% for the current fiscal cycle.
The Demand Crisis: Mortgage Rates and Buyer Paralysis
The primary driver of the current price contraction is a historic collapse in buyer demand. Pending sales—a leading indicator of future closed transactions—fell 3.6% month-over-month in October and remain 15% lower than the previous year. Excluding the anomalous shutdown during the spring of 2020, transaction activity has reached its lowest level since 2013.
The psychological and mathematical barrier of 7% mortgage rates remains the pivotal factor. In October, the average 30-year fixed-rate mortgage climbed to approximately 7.4%, up from 6.9% in September and roughly 6% at the start of the year. This volatility has removed hundreds of thousands of potential buyers from the market. Real estate economists note that the "7% threshold" serves as a major deterrent; when rates dip toward 6%, application activity surges, but at current levels, the cost of financing renders the median home unaffordable for a significant portion of American households.
Furthermore, real wage growth—inflation-adjusted income—has remained largely stagnant or negative for many sectors, further eroding purchasing power. With the cost of living rising across all categories, the ability to save for a down payment or manage a monthly mortgage that is 40% to 50% higher than it would have been three years ago has created a hard ceiling on price appreciation.
The Inventory Paradox: Rising Supply Amidst Dwindling Listings
The supply side of the equation presents a nuanced picture that complicates the "housing crash" narrative. Traditionally, a crash is precipitated by a flood of forced selling or "distress" inventory. Currently, the market is not seeing a surge in new listings; in fact, new listings fell 4% year-over-year in October as homeowners remained hesitant to trade their low-interest debt for current market rates.
However, active inventory—the total number of homes available for sale—has risen to its highest level since early 2020, up 1% from September. This increase is not driven by an influx of sellers, but rather by the "stale" nature of current listings. Properties are sitting on the market for longer durations as buyers become increasingly selective or unable to qualify for loans.
This build-up of "passive inventory" is granting buyers unprecedented leverage. Data shows that 61% of homes sold in October closed below their initial list price, and 36% of active listings underwent a price cut—the highest percentage in the history of several major real estate tracking platforms. Additionally, the rate of contracts falling through has hit 15%, as buyers use inspection periods or financing contingencies to exit deals that no longer feel advantageous.
Macroeconomic Headwinds: Sticky Inflation and Federal Reserve Policy
The broader economic environment suggests that relief in the form of lower mortgage rates is unlikely in the immediate future. The Consumer Price Index (CPI) report for October showed a 0.4% monthly increase, translating to an annualized inflation rate of nearly 5%. Core CPI, which strips out volatile food and energy costs, has risen by 0.3% for three consecutive months, indicating that inflationary pressures have moved beyond energy and into the broader services economy.
This "sticky" inflation has forced the Federal Reserve to maintain a hawkish stance. While many market participants had hoped for rate cuts in late 2024 or early 2025, the recent data suggests that further rate hikes remain a possibility. For the residential housing market, the Fed’s actions are indirectly influential via the 10-year Treasury yield. Bond investors, wary of inflation eroding long-term returns, have pushed yields higher, which in turn drives mortgage rates upward.
Economists argue that a Federal Reserve rate hike might actually be necessary to stabilize the long-term mortgage market. By demonstrating a commitment to crushing inflation, the Fed could eventually soothe the bond market, leading to a narrowing of the spread between Treasury yields and mortgage rates. However, in the short term, this policy ensures that borrowing costs will remain elevated, placing the full burden of market rebalancing on home prices.
Regional Volatility: The Sharp Decline of Pandemic Darlings
While the national median price decline is 0.4%, the correction is highly localized, with certain regions experiencing much sharper contractions. Markets that saw the most explosive growth during the 2020-2022 period are now leading the downturn.
- Austin, Texas: Long considered the epicenter of the pandemic tech migration, Austin has seen prices fall by an additional 6.5% this year, continuing a multi-year slide from its peak.
- Seattle, Washington: High interest rates and a cooling tech sector have driven prices down 5% year-over-year.
- Nashville, Tennessee: Another former high-growth market, Nashville has recorded a 5% decline as inventory levels finally catch up with dwindling demand.
- The American South: States like Florida and Arizona are seeing a concentration of "underwater" mortgages and rising inventory as the cost of insurance and taxes adds to the burden of high mortgage payments.
Conversely, markets in the Northeast and parts of the Midwest remain more resilient, often due to a more acute lack of inventory and a less speculative run-up in prices during the previous boom.
Risk Profile: Equity Cushions versus Rising Delinquencies
Despite the transition to negative price growth, the structural integrity of the housing market remains distinct from the 2008 financial crisis. The primary safeguard is the record level of homeowner equity, which currently stands at $17.5 trillion. The average homeowner possesses approximately $204,000 in "tappable" equity, providing a massive buffer against foreclosure.
However, cracks are beginning to appear in specific segments. Delinquency rates for FHA and VA loans—which typically require lower down payments—have begun to tick upward. FHA delinquency rates have hovered near 6%, a notable increase from previous years. Furthermore, approximately 1.1 million borrowers are currently "underwater," meaning they owe more on their mortgages than their homes are worth. While this represents only 2% of all mortgage holders, it signifies a return of a risk factor that had been virtually non-existent for a decade.
The ultimate "wildcard" for the market remains the labor market. As long as unemployment remains low, most homeowners will choose to stay in place rather than sell at a loss. However, if macroeconomic pressures lead to significant job losses, the "reluctant seller" could become a "forced seller," potentially accelerating the current correction into a more severe downturn.
Broader Impact and Investment Implications
The transition to a buyer’s market presents a complex landscape for real estate investors. For "buy-and-hold" investors, the current environment offers an opportunity to acquire assets at a discount with significantly less competition. The ability to negotiate terms—such as seller concessions for rate buy-downs or repairs—has returned to the market for the first time in years.
However, the "fix-and-flip" sector faces significant headwinds. The transition period from a rising market to a falling one is notoriously dangerous for short-term speculators, as the value of an asset can decline during the renovation period, erasing projected profit margins.
As the market enters the winter months—traditionally a period of seasonal cooling—the industry will be watching to see if the 0.4% decline is the floor or merely the beginning of a sustained period of price discovery. For now, the "Great Stall" has broken, and the U.S. housing market has officially entered a new era of price contraction.
