

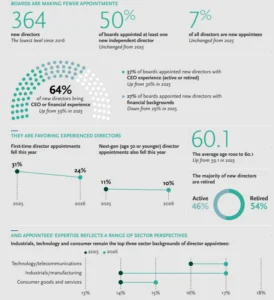
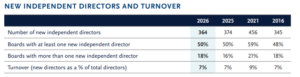
Board refreshment within the S&P 500 experienced a noticeable slowdown in 2026, with a significant shift in the profile of newly appointed directors. A total of 364 new independent directors joined S&P 500 boards, representing the lowest number of appointments since 2016. This figure, out of a total of 5,204 directorships, signifies a cooling trend in board turnover, which declined from 0.8 new directors per board in the preceding year to 0.7 in 2026. This deceleration in board refreshment is a notable departure from previous patterns where the number of director departures closely mirrored new appointments. In 2026, however, 418 directors left S&P 500 boards, a 15% increase compared to the number of new directors appointed in the same year. This divergence suggests a more deliberate and potentially constrained approach to board composition.

The analysis, based on a Spencer Stuart memorandum authored by George Anderson, Rebecca Thornton, and Ann Yerger – all Partners and Co-Leaders of the Board practice at Spencer Stuart – highlights a strategic pivot in the qualifications sought by S&P 500 companies for their directorial roles. While the overall number of new directors has decreased, there is a marked emphasis on candidates with proven executive leadership experience, particularly those who have held CEO positions. This trend underscores a growing preference for seasoned leaders capable of navigating complex corporate landscapes.
CEO Backgrounds Take Priority in the Boardroom
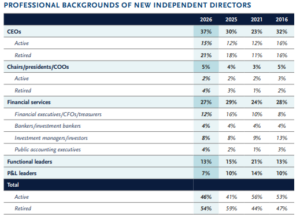
The class of 2026 saw a pronounced increase in the proportion of new directors with CEO experience. A substantial 37% of all newly appointed directors in 2026 were current or former CEOs, representing a seven percentage point increase from the previous year. This marks the highest percentage of CEO appointments since 2012, when the figure peaked at 42%. Overall, the trend indicates a stronger demand for candidates possessing either CEO or significant financial expertise, with 64% of incoming directors falling into these categories, up from 59% in 2025. This shift suggests that boards are increasingly prioritizing individuals with direct experience in steering large organizations and managing financial stewardship.
Despite this emphasis on executive experience, retired individuals continued to constitute the majority of new director appointments, a consistent trend observed in previous years. This indicates a continued reliance on experienced professionals who, while no longer in active executive roles, bring a wealth of knowledge and strategic insight to the boardroom.
Younger Director Appointments Continue to Decline
The trend towards appointing younger directors appears to be reversing, with the average age of new directors increasing to 60.1 years in 2026, up from 59.1 years in 2025. This demographic shift contrasts with earlier years where there was a notable push for younger talent. The youngest new director appointed in 2026 was 29 years old, while the oldest remained 77, mirroring the age range of the previous year. The average age of sitting independent directors across S&P 500 companies stands at 63.8 years.
The representation of "next-generation" directors – those aged 50 or under – saw a decline, accounting for only 10% of the incoming class in 2026, down from 11% in 2025. Among these younger appointees, the majority (86%) are actively employed, suggesting that the trend towards bringing in younger, actively engaged executives is still present, albeit at a reduced rate.
First-Time Director Appointments Also Continue to Decline
The pipeline of first-time public company directors has also narrowed. In 2026, individuals appointed to their first public company board constituted 24% of the new director class, a notable decrease from 31% in 2025 and 34% in 2024. A significant majority (62%) of these first-time appointees are actively employed, a higher proportion compared to directors with prior public board experience (40%). This suggests that companies are increasingly looking to experienced individuals for board roles. Among these first-time directors, 55% bring financial experience or specific functional expertise, with financial executives—including CFOs, bankers, investors, and accounting executives—making up 34% of this group.
Fewer Independent Directors Retired from Boards This Year
The decline in new director appointments is partly explained by a reduction in the number of independent directors leaving S&P 500 board service. In 2026, 377 independent directors stepped down, a 10% decrease from the previous year. The departing directors averaged 67.5 years of age and had served an average of 11.3 years on boards. The majority of these departures occurred in the directors’ 70s (50%), with a substantial portion also leaving in their 60s (37%).
A significant trend observed is the decreasing proportion of directors subject to mandatory retirement age policies. In 2026, only 63% of departing directors were subject to such policies, down from 69% in 2025 and 73% in 2024. Among those with mandatory retirement policies, an increasing percentage (32% in 2026, up from 30% in 2025) retired on or after the stipulated age. However, a substantial 55% still left their boards more than three years before reaching their mandatory retirement age. The average departure age relative to mandatory retirement policies also shifted, with directors leaving 6.4 years before the mandatory age in 2026, compared to 6.2 years in 2025. Furthermore, the proportion of departing directors with at least 15 years of tenure experienced a sharp decline, falling from 30% in 2025 to 17% in 2026, indicating a move towards more dynamic board compositions with shorter tenures.
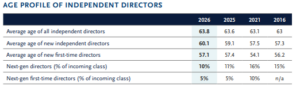
An interesting observation relates to gender and retirement patterns. Women independent directors tend to join and leave boards earlier than their male counterparts. New women directors are, on average, two years younger than men and are more likely to retire in their 60s, whereas men are more likely to retire in their 70s.
Diverse Appointments Drop Amidst Shifting Disclosure Practices
The representation of diverse executives among newly appointed directors saw a decline in 2026. The proportion of women appointed to boards decreased, and the percentage of boards that expanded to include one or more women directors remained static at 10% compared to the previous year.
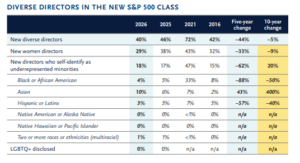
Conversely, the share of new directors who self-identify as underrepresented minorities saw a slight increase. More boards also expanded to include at least one director from this group, with 6% of boards doing so in 2026, up from 5% in 2025. However, women accounted for a smaller percentage of underrepresented minority appointments in 2026, at 7%, down from 9% in the prior year.
These diverse director appointments reflect a varied range of professional backgrounds. Diverse appointments are more likely to originate from functional leadership roles such as Chief Human Resources Officer (CHRO), Chief Marketing Officer (CMO), or Chief Technology Officer (CTO). Among new women independent directors, over half possess CEO or financial experience, with a notable increase in CEO backgrounds attributed to retired CEOs, who constituted 17% of appointments, a significant rise from 6% in 2025. This aligns with a modest 4% increase in the number of women serving as S&P 500 CEOs, from 46 in 2025 to 48 in 2026.
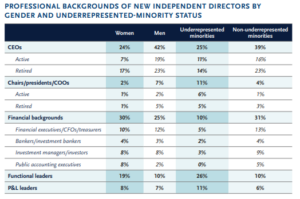
For new directors identifying as underrepresented minorities, half are functional executives or bring CEO experience. CEO representation within this group has grown to 24% in 2026 from 22% the previous year. This trend is supported by an overall rise in the number of underrepresented minorities serving as CEOs, increasing by 10% from 67 in 2025 to 74 in 2026.
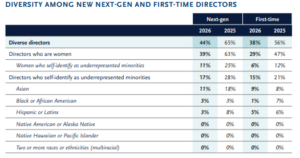
However, the trend of declining diverse next-generation and first-time director appointments is concerning. The average age of diverse new directors saw a slight increase in 2026, although they remain younger on average than non-diverse new directors. The share of diverse next-gen appointments dropped sharply to 44% in 2026 from 65% in 2025. While women continue to form the majority of this group, both their representation and the proportion of underrepresented minority next-gen directors saw significant declines.
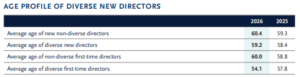
Similarly, boards appointed fewer first-time directors from diverse backgrounds. The representation of women in this category fell substantially to 29% from 47% in 2025. The proportion of first-time directors identifying as underrepresented minorities has also continued its downward trajectory from a 2021 peak, falling to 15% in 2026 from 65% in that year.
Global Experience Remains Part of the Boardroom Mix, but Declining
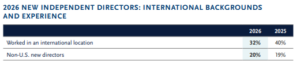
S&P 500 boards have significantly reduced their appointment of directors with international experience, continuing a downward trend observed in recent years. The proportion of new directors born outside the United States has increased by one percentage point from the previous year to 20%, more than doubling from a decade ago when it stood at 8%. This suggests a potential recalibration of global perspective sought in board compositions.
S&P 500 Boards Prioritize Technological and Manufacturing Backgrounds
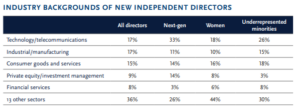
In terms of industry backgrounds, technology/telecommunications and industrial/manufacturing sectors emerged as the most common for the class of 2026, each accounting for 17% of new appointments. The industrial/manufacturing sector last held the leading position for new director backgrounds in 2001. The technology/telecommunications sector is particularly prevalent among new next-generation directors, new women directors, and new directors identifying as underrepresented minorities, highlighting its importance for emerging leadership profiles.
Board Diversity Holds Steady as Boards Pull Back on Disclosure
While overall diversity metrics within S&P 500 boards have remained largely stable, a more significant shift is the decreasing tendency of boards to disclose diversity data and formal diversity policies. This move towards reduced transparency could have implications for future diversity initiatives and accountability.
Diversity in the Boardroom is Largely Unchanged
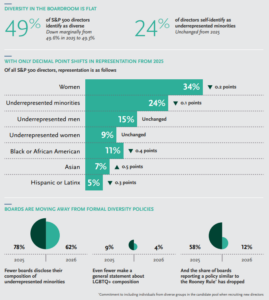
Diversity metrics within the S&P 500 have plateaued. The representation of underrepresented minorities remained static at 24%, while the representation of women saw a marginal decline of 0.2 percentage points, from 34.6% to 34.4%. Consequently, overall diversity decreased slightly by 0.3 percentage points, from 49.6% to 49.3%.
Underrepresented Minority Representation is Unchanged
For the second consecutive year, 24% of S&P 500 directors self-identify as underrepresented minorities, a figure that has grown from 21% in 2021 and 15% in 2016. All but eight boards (98%) now include at least one director identifying as an underrepresented minority, a slight decrease from 99% in the previous year but a substantial improvement from 88% a decade ago. The gender distribution within this group remained unchanged from the prior year, although the proportion of women directors identifying as underrepresented minorities has more than doubled since 2016. Notably, only two boards disclosed having a director who self-identifies as LGBTQ+.
Women Make Up More Than a Third of S&P 500 Directors
Women continue to constitute just over a third of S&P 500 directors, with 34% in 2026 compared to 35% in 2025. This figure represents a 16% increase from five years ago and a 62% increase from a decade prior. On average, S&P 500 boards have four women directors, the same as in 2025, compared to three in 2021 and two in 2016. A vast majority of boards (99%) now have at least two women directors, with only four boards having just one.
Diverse Representation in Board Leadership is a Mixed Picture
The representation of women in independent board leadership roles saw an increase in 2026, particularly as independent board chairs, though the share of women lead directors experienced a slight decline. The representation of women on committee chairs continued to grow, with notable gains on audit committees, compensation committees, and nominating/governance committees. For directors identifying as underrepresented minorities, their representation in board leadership roles remained largely unchanged from 2025, though their presence in committee leadership generally increased year over year.
Boards are Moving Away from Formal Diversity Policies
A concerning trend is the diminishing inclination of companies to disclose aggregate information on directors who self-identify as underrepresented minorities, mirroring a similar trend in LGBTQ+ disclosures. The adoption of formal diversity policies, such as the Rooney Rule which mandates the inclusion of diverse candidates in recruitment pools, has seen a dramatic fall. In 2026, only 12% of boards observed such policies, a steep decline from 58% in 2025 and 39% in 2021. This retreat from formal diversity recruitment policies, coupled with a slowdown in new diverse director appointments, signals a potentially challenging period for advancing boardroom diversity in the near future. The emphasis on CEO and financial expertise, while potentially strengthening immediate leadership capabilities, may inadvertently narrow the focus on a broader range of experiences and backgrounds essential for long-term resilience and innovation.
