

The landscape of executive compensation within private companies is undergoing significant shifts, with financial services and biotechnology sectors emerging as top earners for Chief Executive Officers, while retail and certain other industries are experiencing a downturn in projected pay. New data from a comprehensive 2026-2027 survey of 1,551 U.S. companies reveals a complex picture, where industry classification, company size, and operational models significantly influence CEO remuneration. The findings underscore the critical need for nuanced benchmarking that extends beyond simple industry averages.
Sectoral Dominance in CEO Compensation
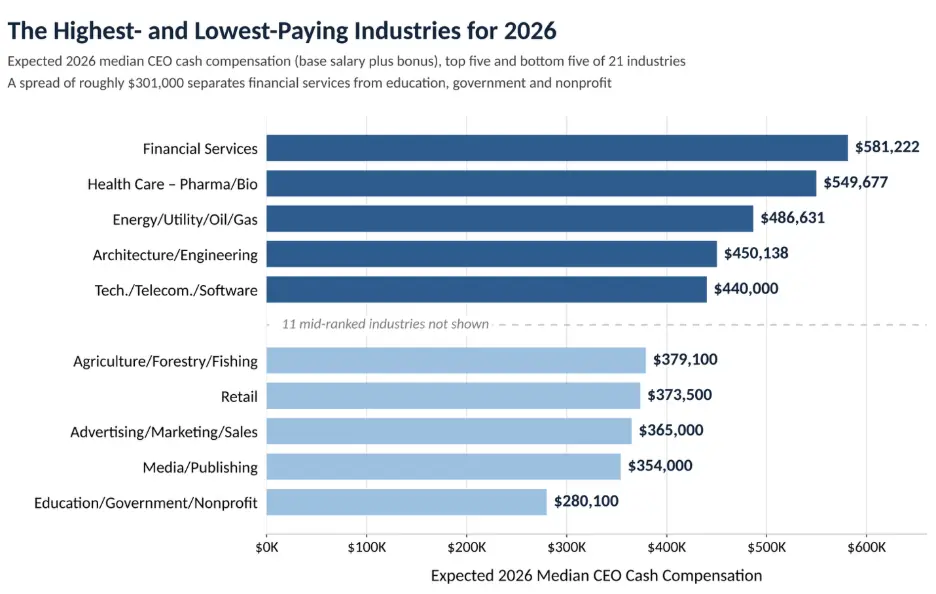
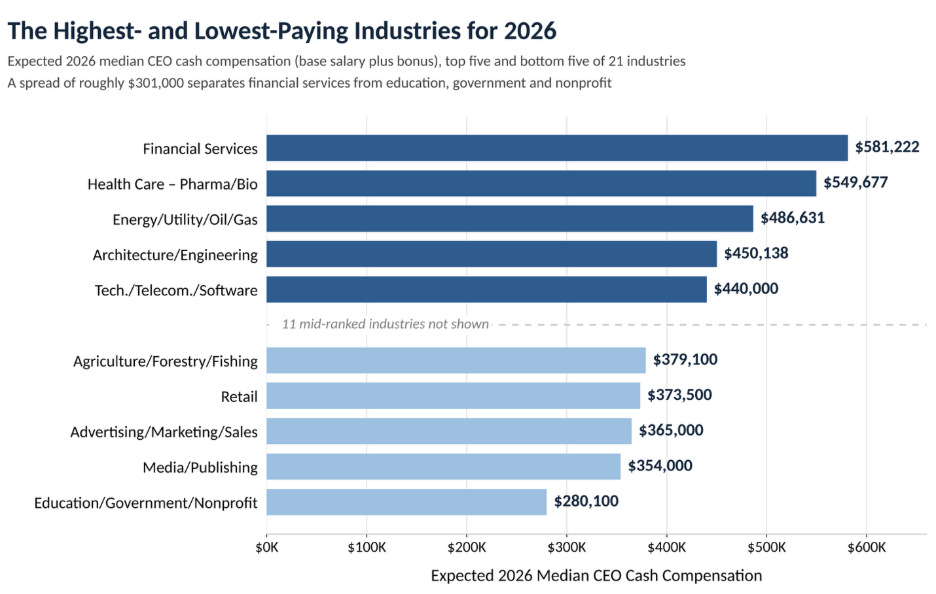
According to the latest projections for 2026, CEOs in the financial services sector are poised to command the highest median cash compensation, estimated at $581,222. This figure substantially outpaces the $280,100 expected for leaders in education, government, and nonprofit organizations, which occupy the lowest rungs of the compensation ladder. This substantial disparity, exceeding double the earnings, highlights the divergent financial realities and compensation philosophies across different economic sectors.
Following closely behind financial services, CEOs in the pharmaceutical and biotechnology sectors are projected to earn a median cash compensation of $549,677. The energy, utilities, and oil and gas industries rank third, with an expected median CEO compensation of $486,631. Rounding out the top five highest-paying sectors are architecture and engineering ($450,138) and technology, telecommunications, and software ($440,000).
Conversely, the lower end of the compensation spectrum is populated by education, government, and nonprofit organizations, with a median expected cash compensation of $280,100. Media and publishing follow at $354,000, with advertising, marketing, and sales ($365,000), retail ($373,500), and agriculture, forestry, and fishing ($379,100) completing the bottom five. This creates a significant gap of approximately $300,000 between the highest and lowest compensated CEO sectors.
The Nuances of Compensation Benchmarking
The stark differences in CEO pay are not solely attributable to industry labels. Experts emphasize that a variety of factors, including company size, business models, profitability, and available financial resources, play crucial roles in shaping executive compensation structures. A financial services firm, with its inherent focus on capital management and investment, often operates with a different compensation framework compared to a nonprofit organization, which may prioritize mission-driven metrics and public funding streams.
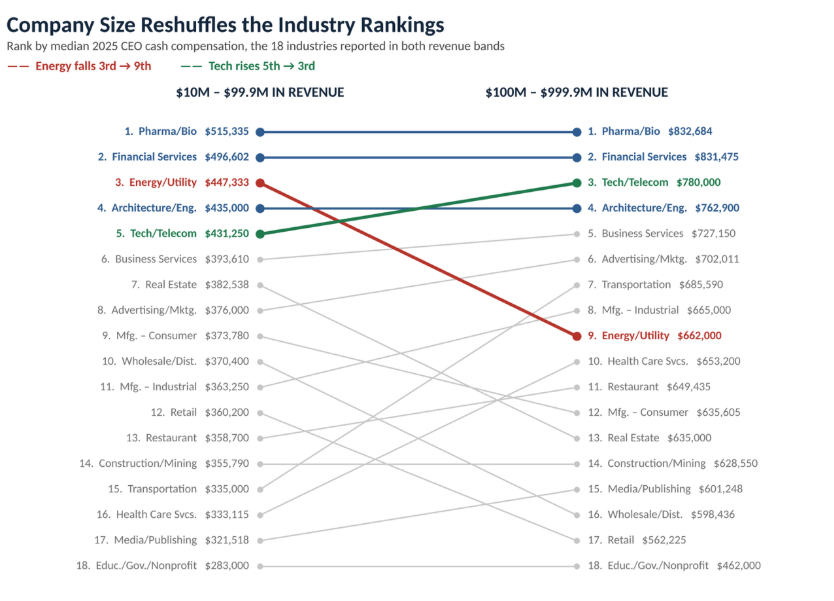
This complexity is underscored by an examination of actual 2025 compensation data, segmented by company revenue. Among companies generating between $10 million and $99.9 million in annual revenue, pharmaceutical and biotechnology CEOs led the surveyed industries with a median cash compensation of $515,335. Financial services followed at $496,602, with energy at $447,333 and architecture and engineering at $435,000. Technology CEOs in this revenue bracket earned a median of $431,250, positioning them competitively despite ranking fifth in the overall 2026 projections.
The compensation landscape shifts again when examining larger private companies with revenues between $100 million and $999.9 million. In this segment, pharmaceutical/biotech and financial services are nearly tied, with median CEO cash compensation at $832,684 and $831,475, respectively. Technology firms ascend to third place within this revenue band, reporting $780,000, followed by architecture and engineering at $762,900. Notably, the energy sector, which ranks third overall in the 2026 forecast, falls to $662,000 in this revenue tier, indicating that its overall high ranking is influenced by a concentration of larger entities.
These findings highlight the limitations of relying solely on broad industry averages. A sector with a higher prevalence of large, high-revenue companies may report elevated executive compensation figures that don’t fully reflect the compensation levels at similarly sized businesses in other industries. Therefore, when benchmarking CEO pay, both industry affiliation and company size emerge as equally critical determinants.
Understanding the Drivers of Higher Compensation
The variations in CEO compensation across industries can be attributed to the distinct ways companies generate value and the unique demands placed upon their leadership.
Financial Services: Companies in this sector often engage in complex operations involving capital management, intricate regulatory compliance, significant risk assessment, and strategic investment decisions. These core functions directly impact performance and, consequently, executive remuneration. The sector’s compensation structures often feature substantial bonus opportunities, with financial services CEOs anticipating the largest median bonuses in 2026, projected at $162,500. However, when viewed as a percentage of base salary, architecture and engineering firms lead, with bonuses constituting 50.2% of the base pay.
Pharmaceutical and Biotechnology: This sector is characterized by lengthy product development cycles, inherent scientific uncertainty, stringent regulatory approval processes, and substantial investments in research and development. These factors necessitate highly specialized leadership capable of navigating complex scientific and market challenges. The projected median CEO bonus for pharma/biotech in 2026 is $150,000, second only to financial services, reflecting the high stakes and potential rewards associated with innovation and market success.
Technology, Telecommunications, and Software: Technology companies typically value leadership that can foster innovation, adapt to rapidly evolving business models, and manage intense competitive pressures. While the overall sector ranking might not fully capture its compensation competitiveness, the company-size comparisons suggest a strong demand for executive talent capable of driving growth in this dynamic field.
Education, Government, and Nonprofits: These organizations operate under distinct financial and governance frameworks. Compensation decisions in these sectors are often influenced by mission objectives, funding sources (including public funds and donations), and the scrutiny of stakeholders, which differ significantly from the commercial imperatives of for-profit businesses.
Retail and Consumer-Facing Businesses: Companies in the retail sector face pressures related to labor costs, fluctuating operating margins, and demand volatility. These economic realities can constrain the financial resources available for executive incentive programs, impacting overall compensation levels.
Historical Trends and Shifting Fortunes
A historical analysis of compensation trends over the past three years provides further insight into the evolving dynamics of executive pay. Financial services has consistently ranked at the top, though its projected compensation has seen fluctuations. In 2024, financial services CEOs forecasted median cash compensation of $597,500, which dipped to $540,265 in 2025 before recovering to $581,222 in 2026.
The pharmaceutical and biotechnology sector has experienced a more pronounced trajectory. Expected compensation fell from $532,312 in 2024 to $476,517 in 2025, then rebounded to $549,677 in 2026. A significant portion of this recent rebound is attributed to bonuses. Pharma/biotech CEOs anticipate a median bonus of $150,000 in 2026, a substantial increase from the $90,000 projected in the 2025 forecast, while base salaries have seen more modest growth. This pattern is indicative of a sector where compensation is closely tied to business performance and future expectations.
In contrast, the energy, utilities, and oil and gas sector has demonstrated remarkable stability in expected CEO cash compensation across the three years: $485,256 in 2024, $491,616 in 2025, and $486,631 in 2026. While remaining a high-paying sector overall, its consistent compensation levels contrast with the more dynamic movements observed in financial services and biotech.
At the lower end of the spectrum, education, government, and nonprofit organizations have shown striking consistency in their compensation figures, with projected median cash compensation at $275,850 in 2024, $278,600 in 2025, and $280,100 in 2026. Similarly, media and publishing has remained near the bottom, with expected compensation hovering between $350,510 and $359,250 over the same period.
Retail’s Decline and Industrial Manufacturing’s Recovery
Among commercial industries, the retail sector stands out for its downward compensation trend, diverging from the upward trajectory of leading sectors. Retail CEOs anticipated median cash compensation of $411,695 in 2024. This figure declined to $406,672 in 2025 and is projected to fall further to $373,500 in 2026. A significant driver of this decline is the reduction in bonuses, which are expected to drop from $117,632 in the 2024 forecast to $75,000 in 2026, while base salaries have remained relatively stable. This shift in variable pay suggests a heightened emphasis on financial performance metrics within executive incentive structures, although variations in survey samples year-over-year could also contribute to these observed trends.
The wholesale and distribution sector, after experiencing a dip from $433,400 in 2024 to $383,933 in 2025, shows a projected rebound to $423,338 for 2026. Industrial manufacturing also demonstrates a recovery after a decline in 2025. Expected median CEO cash compensation in this sector fell from $408,000 in 2024 to $390,000 in 2025 but is forecasted to reach $412,500 in 2026. Consumer-goods manufacturing has maintained a relatively steady compensation level, with expected earnings of $431,500 in 2026, compared to $423,500 in 2024. These movements collectively indicate evolving financial conditions, shifting compensation expectations, and potential changes in the composition of companies responding to these surveys, offering valuable signals for market observers.
Implications for 2027 and Beyond
The comprehensive data from the 2026-2027 survey provides critical insights for boards of directors and companies when reviewing CEO compensation strategies. Three key takeaways emerge:
-
Industry Context is Paramount: While company size is a significant factor, industry classification provides essential context for understanding compensation levels. Different sectors inherently possess varying revenue potentials, profitability margins, and compensation philosophies driven by their unique operational models and market dynamics.
-
Size Matters Significantly: The data clearly illustrates that larger private companies, particularly those with revenues exceeding $100 million, offer substantially higher CEO compensation compared to smaller entities, even within the same industry. This disparity underscores the increased responsibility, complexity, and strategic impact associated with leading larger organizations.
-
Beyond the Average: Relying on simple industry averages for compensation benchmarking can be misleading. A more sophisticated approach that integrates industry data with company size, revenue, ownership structure, and profitability is essential for establishing fair and competitive executive remuneration packages.
The lesson for companies is not to disregard industry comparisons but to utilize them with greater discernment. For detailed benchmarks across various company sizes, industries, and ownership structures, the Chief Executive Group Research’s CEO & Senior Executive Compensation Report offers more granular insights. As the private company landscape continues to evolve, a data-driven and context-aware approach to executive compensation will be crucial for attracting and retaining top leadership talent.
