

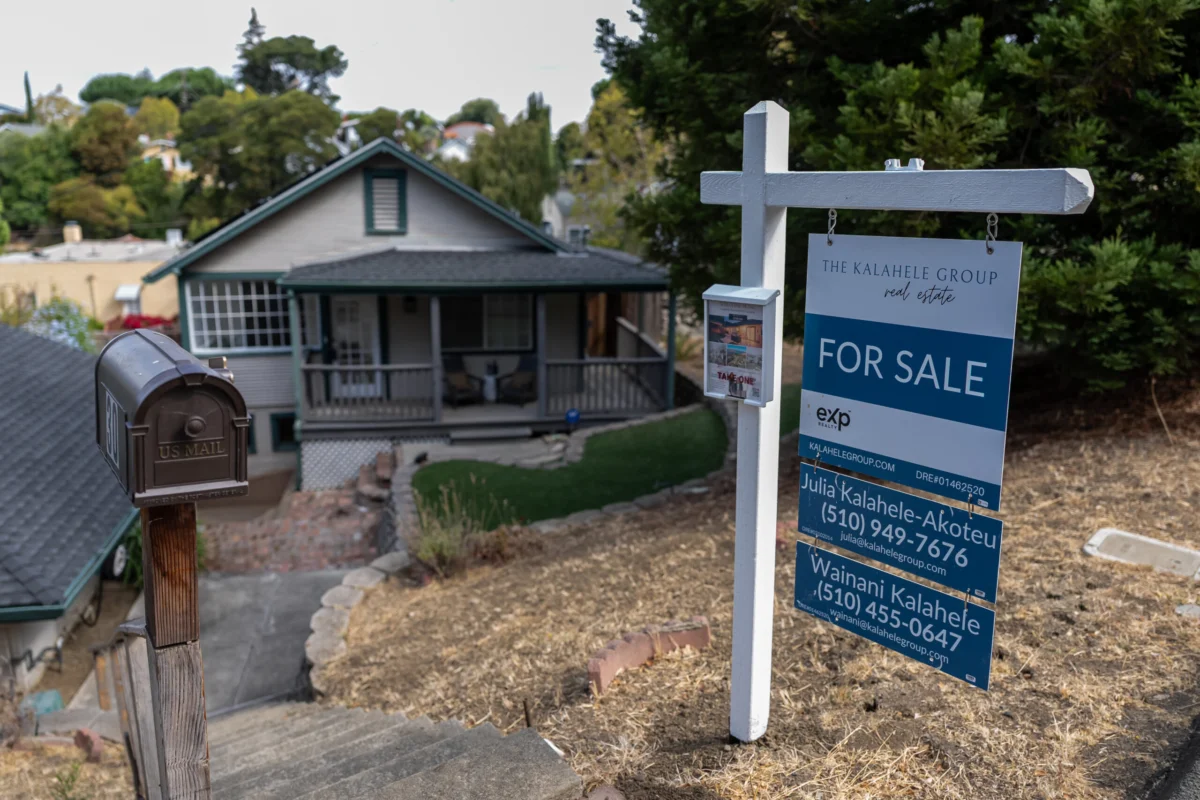
The U.S. housing market experienced a notable slowdown in August 2026, with sales of previously owned homes falling 2% from July to a seasonally adjusted, annualized rate of 3.98 million units. This marks the slowest pace of sales activity since June 2025, reflecting the persistent challenges posed by elevated mortgage rates and stubbornly high home prices. The National Association of Realtors (NAR) report, released on Thursday, September 3, 2026, underscored a market grappling with affordability constraints, with the dip felt most acutely in the Northeast and Midwest regions of the country.
On a year-over-year basis, August 2026 sales were down 1.2% compared to August 2025. This downturn comes despite a paradoxical year-to-date increase in existing home sales, which are up 1.6% through the first eight months of 2026. The discrepancy highlights a market that started the year with stronger momentum but has progressively cooled as borrowing costs escalated.
The Enduring Impact of Elevated Mortgage Rates
The primary driver behind the August slowdown, as confirmed by NAR’s chief economist Lawrence Yun, is the sharp upward trajectory of mortgage rates. Housing market transactions are typically based on closing dates, meaning the August sales figures largely reflect contracts likely signed in June and July 2026. It was during this period that mortgage rates experienced a significant surge, following a period of relative stability or even slight declines earlier in the spring.
To understand this phenomenon, it’s crucial to examine the broader economic context. Throughout 2025 and into 2026, the Federal Reserve has maintained a hawkish stance on monetary policy, aggressively raising the federal funds rate in a bid to curb persistent inflation. While the federal funds rate doesn’t directly dictate mortgage rates, it heavily influences them by impacting yields on U.S. Treasury bonds, particularly the 10-year Treasury note, which often serves as a benchmark for fixed-rate mortgages. As the Fed signaled continued tightening and inflation proved more entrenched than initially anticipated, bond yields climbed, pushing conventional 30-year fixed mortgage rates well above the 7% threshold, and at times nearing 8% in mid-2026. This starkly contrasts with the sub-3% rates observed during the pandemic-era housing boom, and even the 5-6% range seen in early 2025.
Lawrence Yun elaborated on this inverse relationship: "Mortgage rates and home sales move in opposite directions, so it’s not surprising to see a mild dip in home buying activity due to high mortgage rates." He further noted, however, that "Still, home prices are rising, and existing home sales are actually up 1.6% year-to-date through the first eight months of the year," suggesting a complex market dynamic where demand, albeit dampened, still outstrips available supply in many areas.
Regional Disparities and Supply Dynamics
The slowdown was not uniform across the nation. The Northeast and Midwest regions bore the brunt of the sales decline, which can be partly attributed to their specific market conditions. While detailed regional data on mortgage rate sensitivity isn’t always granular, these areas have historically seen tighter inventory levels and, consequently, have experienced significant price appreciation, making the impact of higher rates on affordability particularly acute.
Despite the dip in sales, the overall supply of homes on the market saw a modest increase. Housing supply totaled 1.62 million homes for sale at the end of August, representing a 3.2% rise from July and a 5.9% increase from August 2025. At the current sales pace, this translates to a 4.9-month supply of homes – the highest level recorded in more than a decade, according to NAR data. A balanced market is typically considered to have a 6-month supply, indicating that while inventory is improving, the market still leans towards sellers in many areas, albeit less intensely than in recent years.
The paradox here is that despite this increase in supply, home prices continue their upward trend. The median price of a home sold in August 2026 reached $429,100, up 1.6% from August 2025. This figure represents a new all-time high for the month of August, underscoring the persistent demand and the "sticky" nature of seller expectations. Price gains were most pronounced in the Northeast, correlating with the region’s lowest inventory levels, suggesting that even a slight increase in demand in a constrained market can still push prices higher. Conversely, the West was the only region to experience a year-over-year decline in median prices, potentially reflecting earlier, more aggressive price appreciation and subsequent market adjustments or a greater sensitivity to interest rate hikes given higher median home values in many Western metropolitan areas.
Market Segmentation: Luxury End Resilient, Entry-Level Struggles
A deeper dive into the price segments reveals a bifurcated market. The highest end of the market continues to exhibit remarkable resilience, largely insulated from the pressures affecting other segments. Compared with August 2025, sales of homes priced between $100,000 and $250,000 saw a significant decline of 10%. This indicates severe affordability challenges for first-time homebuyers and those in lower-income brackets, where even modest increases in mortgage rates can make homeownership unattainable.
In stark contrast, sales of homes priced above $1 million were 3.9% higher in August 2026 compared to the previous year. The million-dollar-plus range was the only price segment to register an increase in sales, highlighting the robustness of demand among affluent buyers who are often less reliant on mortgage financing or have access to more favorable lending terms. These buyers may also be less sensitive to minor fluctuations in interest rates, viewing real estate as a long-term investment or a luxury good.
Another indicator of the cooling market is the average time homes spend on the market. In August, homes averaged 31 days on the market, a slight increase from 29 days in July. While still relatively quick compared to historical norms (pre-pandemic averages often saw homes on the market for 60-90 days), this trend suggests that intense bidding wars are becoming less common, and buyers are taking more time to make decisions, indicating a shift from a frenzied seller’s market to one that is beginning to find a new equilibrium.
Evolving Buyer Profiles and Investor Pullback
The composition of homebuyers also saw shifts in August 2026. Buyers paying entirely in cash constituted 27% of all sales, a slight uptick from July but a minor decrease from August of the previous year. The prevalence of cash buyers in a high-interest-rate environment is unsurprising, as these individuals are completely shielded from the burden of mortgage costs, making their offers highly attractive to sellers.
First-time buyers, despite the formidable affordability hurdles, made up 30% of August sales. This figure represents a slight increase from both July 2026 and August 2025, a testament to their continued aspiration for homeownership. Their ability to enter the market often involves significant financial sacrifices, such as pooling resources with family, utilizing down payment assistance programs, or extending their search to more affordable, albeit sometimes less desirable, locations or smaller properties. Government-backed loans, like FHA loans, which often have lower down payment requirements, likely play a critical role for this demographic.
Conversely, investor and second-home buyer activity saw a noticeable decline. These groups accounted for just 15% of August sales, a significant drop from 21% in August 2025. This pullback can be attributed to several factors. Higher borrowing costs diminish the profitability of rental properties and make speculative investments less appealing. Furthermore, many investors are likely waiting for clearer signals on future interest rate movements and potential price corrections before re-entering the market, as their investment decisions are highly sensitive to return on investment calculations.
Broader Economic Implications and Future Outlook
The housing market’s performance is a critical barometer for the broader U.S. economy. A sustained slowdown in home sales can have ripple effects across various sectors, from construction and renovation to home furnishings and real estate services. While the current scenario is not indicative of a collapse, it certainly suggests a significant cooling that could temper overall economic growth.
The Federal Reserve closely monitors housing data as part of its assessment of the effectiveness of its monetary policy in taming inflation. A cooling housing market, characterized by moderating price growth and reduced transaction volume, is generally seen as a desired outcome, as it can help reduce inflationary pressures stemming from rising shelter costs. However, policymakers are also wary of tipping the economy into a recession, thus walking a delicate tightrope.
Looking ahead, the trajectory of mortgage rates will remain the most significant factor influencing the housing market. If inflation continues to show signs of moderation, the Federal Reserve might pause or even consider cutting rates in late 2026 or early 2027, which could provide some relief to prospective homebuyers. However, if inflation proves more stubborn, rates could remain elevated, continuing to suppress sales activity and further testing the affordability limits of many Americans.
Real estate analysts generally agree that the market is undergoing a necessary recalibration after several years of unprecedented growth. While the days of frantic bidding wars and double-digit annual price appreciation may be behind us for the foreseeable future, the market is not collapsing. Instead, it appears to be settling into a more balanced, albeit challenging, environment where buyers have slightly more leverage, but affordability remains a formidable obstacle. The delicate interplay between supply, demand, and interest rates will continue to define the housing landscape in the months to come, with many prospective homeowners and investors carefully watching for signs of stability and a more accessible path to homeownership.
