

Chart patterns are powerful tools in technical analysis, helping traders identify potential trend reversals, continuations, and breakout opportunities. Recognizing these formations allows traders to make informed decisions based on historical price action and market psychology. This article continues the discussion from Part One and focuses on advanced formations and multi-timeframe strategies, including complex base structures, triangle variations, and specialized patterns frequently observed in cryptocurrency markets. It also explores how to integrate these patterns with other analytical methods to improve consistency and confidence in decision-making.
All analyses, calculations, and assessments presented here are based on charting using TradingView, leveraging the most accurate data available at the time of writing. This content is intended for educational and illustrative purposes only and does not constitute financial or investment advice. Readers should always conduct their own research and remain aware that market conditions can change rapidly.

The Evolving Landscape of Cryptocurrency Trading
The cryptocurrency market, characterized by its high volatility and rapid innovation, presents both significant opportunities and considerable risks for traders. As digital assets have matured, so too have the analytical tools employed by market participants. Technical analysis, which relies on historical price and volume data to forecast future movements, remains a cornerstone of trading strategies. Chart patterns, specific formations that emerge on price charts, offer a visual language to understand market sentiment and potential price trajectories. This second part of our series delves into more sophisticated chart patterns, building upon the foundational knowledge introduced previously, and emphasizes their application in the dynamic crypto environment.
The insights presented are derived from meticulous charting and analysis, employing robust data sets. The intention is to provide a comprehensive guide for traders seeking to refine their tactical approaches. It is crucial to reiterate that the cryptocurrency market is inherently unpredictable, and while these patterns offer statistical probabilities, they are not guarantees of future performance. Vigilance, continuous learning, and robust risk management remain paramount for success.
Advanced Continuation Patterns: Navigating Short-Term Momentum
Continuation patterns suggest that the prevailing trend is likely to resume after a period of consolidation. In the fast-paced crypto markets, identifying these patterns accurately can be crucial for capitalizing on sustained price movements.

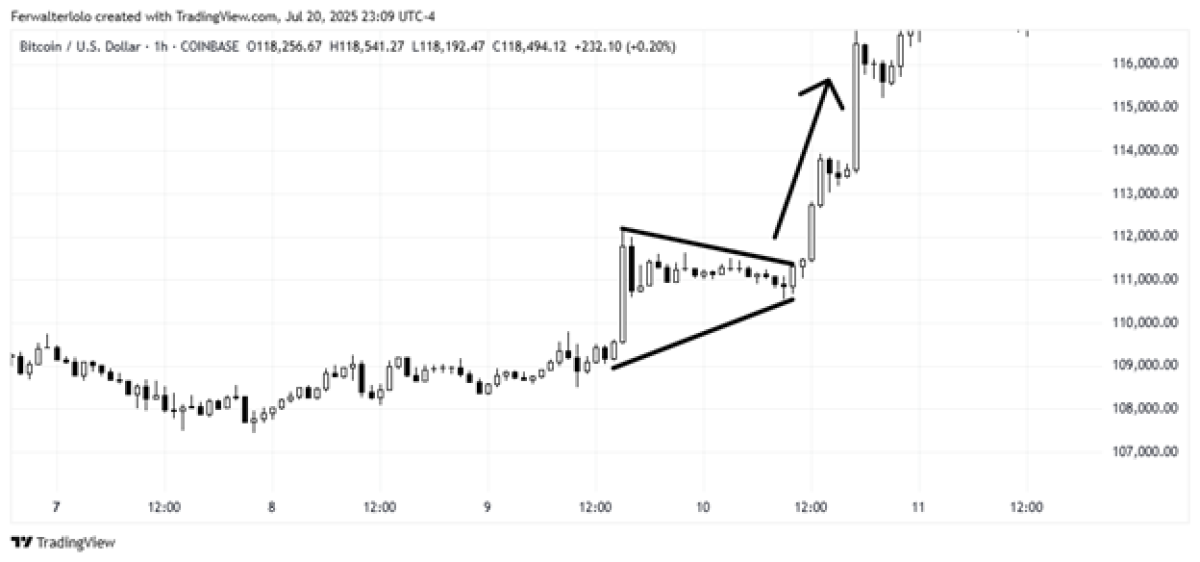
Bullish Pennant: A Sign of Temporary Pause Before Upward Surge
The bullish pennant is a short-term continuation pattern that signals a likely upward breakout. Historically, these patterns have shown a tendency to resolve in the direction of the prior trend, with upward breakouts occurring approximately 70% of the time. A common entry point for traders observing this pattern is often found around the 61.8% Fibonacci retracement level of the preceding price surge, which forms the "pole" of the pennant. The pennant itself is characterized by a small, symmetrical triangle that forms immediately after this sharp advance. Unlike its counterpart, the flag pattern, pennants exhibit minimal slope and tighter, symmetrical price compression, indicating a brief period of equilibrium before buyers regain control.
- Key Characteristics: A sharp, near-vertical price advance (the pole), followed by a period of consolidation forming a small, symmetrical triangle with converging trendlines. Volume typically contracts during the formation of the triangle and expands significantly upon breakout.
- Market Context: This pattern is observed after a strong bullish move, suggesting a brief pause for breath before the upward momentum is expected to resume. In crypto, this can occur during periods of high trading activity and positive sentiment.
- Cons: Pennants are short-term patterns, meaning they can resolve quickly. A false breakout can lead to immediate losses if not managed with stop-loss orders. The symmetrical nature can sometimes lead to confusion with reversal patterns if not properly contextualized within the larger trend.
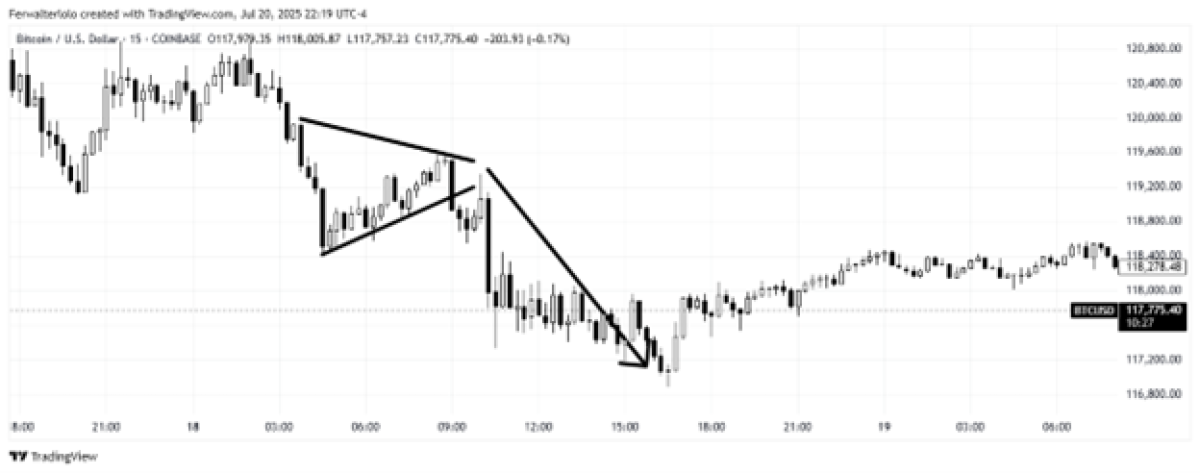
Bearish Pennant: Anticipating Further Downward Movement
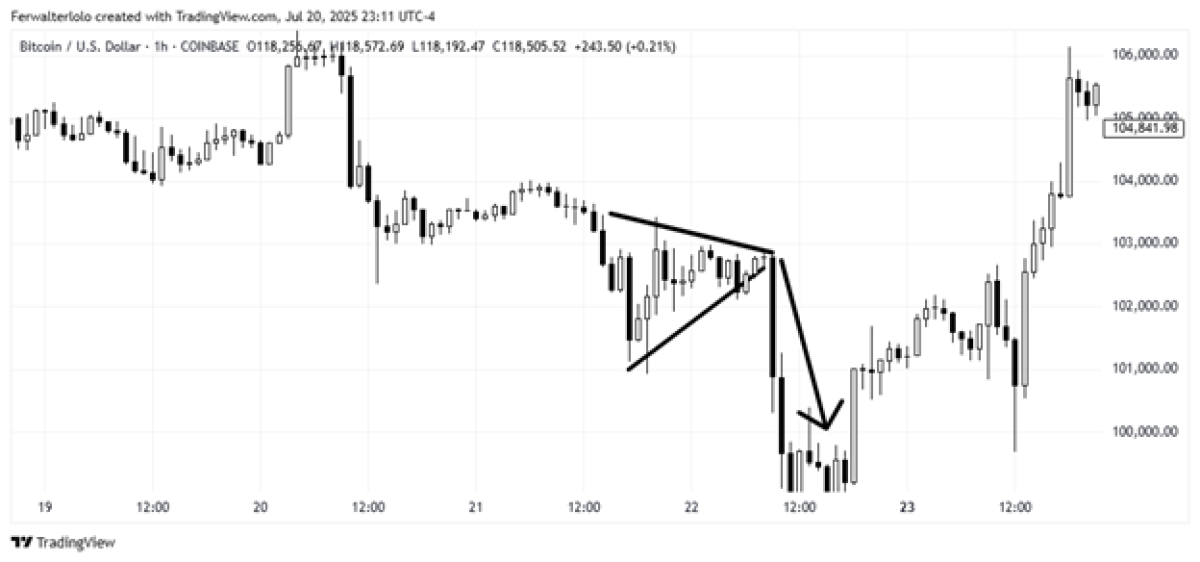
The bearish pennant is the inverse of its bullish counterpart, indicating a temporary pause in a downtrend before further selling pressure is expected. These patterns typically break downward about 70% of the time. Traders often look to the 50% Fibonacci retracement level to confirm resistance before entering a short position. The formation of a bearish pennant immediately follows a sharp price decline, creating a small symmetrical triangle that reflects a brief period of indecision before sellers decisively push prices lower.
- Key Characteristics: A sharp, near-vertical price decline (the pole), followed by a period of consolidation forming a small, symmetrical triangle with converging trendlines. Volume typically decreases during the triangle formation and increases significantly on a downward breakout.
- Market Context: This pattern appears after a significant bearish move, suggesting a temporary consolidation before the downtrend is anticipated to continue. In the crypto space, this can be seen during periods of market fear or negative news.
- Cons: Similar to bullish pennants, bearish pennants are short-term and can lead to rapid losses if a false breakout occurs. Proper risk management, including stop-loss orders, is essential. The tight consolidation can sometimes be mistaken for a reversal pattern if the broader market trend is not considered.
Triangle Patterns: Deciphering Market Indecision
Triangles are among the most frequently observed and analyzed chart patterns. They represent periods of consolidation where the market grapples with opposing forces of supply and demand, often leading to significant price movements upon resolution.
Ascending Triangle: Building Pressure for an Upside Breakout
The ascending triangle is a bullish continuation pattern renowned for its reliability, with a historical success rate of approximately 75%. This formation is characterized by a flat or slightly upward-sloping resistance line and a rising support line, creating higher lows. This structure indicates that buyers are becoming increasingly aggressive, pushing prices higher with each dip, while sellers are holding firm at a specific resistance level. A breakout above the resistance line, ideally on above-average trading volume, signals a continuation of the prior uptrend. Traders often project the height of the triangle upward from the breakout point to establish a price target. Post-breakout, the 38.2% Fibonacci retracement level frequently acts as a support zone, while the 161.8% Fibonacci extension can serve as a secondary, more ambitious target.
- Market Context: Ascending triangles typically form within an existing uptrend, signifying accumulation and increasing buying pressure. In cryptocurrency markets, this can be observed during periods of steady growth where underlying demand is robust.
- Pros: High reliability and clear price targets. The pattern provides distinct entry and exit points, aiding in risk management.
- Cons: False breakouts can occur, especially if volume on the breakout is not significant. The pattern can also evolve into a reversal pattern if the support line is decisively broken.
- Crypto-Specific Tips: In volatile crypto markets, watch for the breakout to be accompanied by a surge in trading volume across major exchanges. False breakouts can be more prevalent due to algorithmic trading. Consider the broader market sentiment and any news events that might influence the breakout’s validity.
- Execution Strategy: Enter a long position upon a decisive close above the resistance line, confirmed by increased volume. Place a stop-loss order just below the breakout level or the rising support line. Target the projected price target or a Fibonacci extension level.
Descending Triangle: Signaling a Potential Downward Break
The descending triangle is the bearish counterpart to the ascending triangle, with a reliability rate of around 70%. This pattern is formed by a flat or slightly downward-sloping support line and a declining resistance line, indicating lower highs. This structure suggests that sellers are becoming more aggressive, pushing prices lower with each rally, while buyers are holding their ground at a specific support level. A breakdown below the support line, typically occurring between 60% and 75% of the pattern’s completion and accompanied by increased volume, signals a continuation of the prior downtrend. The price target is generally calculated by projecting the height of the triangle downward from the breakout point. During pullbacks following a breakdown, the 50% Fibonacci retracement level often acts as a resistance zone.
- Market Context: Descending triangles usually form within a downtrend, indicating distribution and increasing selling pressure. In the crypto market, this can manifest during periods of negative sentiment or when specific assets face selling pressure.
- Pros: Provides clear signals for potential downside continuation and offers defined risk parameters.
- Cons: False breakdowns can occur, particularly if the support level is tested multiple times without a decisive breach. It can also sometimes precede a reversal if the pattern forms at the end of a prolonged downtrend.
- Crypto-Specific Tips: Monitor for significant volume increases on the breakdown. In crypto, news of regulatory crackdowns or major exchange hacks can trigger such breakdowns. Be cautious of "bear traps" where a false breakdown lures short sellers before a sharp price reversal.
- Execution Strategy: Enter a short position upon a decisive close below the support line, confirmed by increased volume. Place a stop-loss order just above the breakdown level or the declining resistance line. Target the projected price target or a Fibonacci extension level.
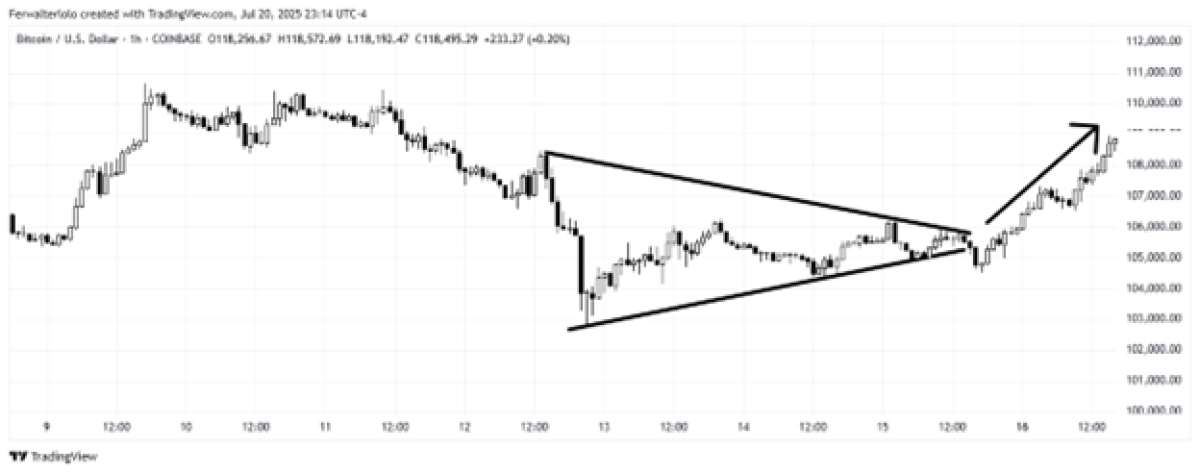
Symmetrical Triangle: A Crossroads of Supply and Demand
The symmetrical triangle is a neutral pattern, meaning it can signal either a continuation or a reversal of the prevailing trend, with a reliability rate of about 65%. It is characterized by converging trendlines, where lower highs are met by higher lows, indicating a balance of power between buyers and sellers. This period of equilibrium often precedes a significant price move in either direction. Breakouts typically occur between 50% and 75% of the pattern’s formation, with minimum price targets calculated by projecting the widest part of the triangle in the direction of the breakout. Post-breakout, the 61.8% Fibonacci retracement level commonly serves as support or resistance, depending on the breakout direction.
- Market Context: Symmetrical triangles can form in any trend and signal a period of consolidation before a resumption or reversal. In crypto, these patterns can appear during periods of market uncertainty or when traders are awaiting significant news or catalysts.
- Pros: Offers flexibility as it can lead to both bullish and bearish outcomes, allowing traders to react to the breakout direction.
- Cons: Its neutral nature makes it inherently less predictable than unidirectional triangles. False breakouts are a significant risk.
- Crypto-Specific Tips: The cryptocurrency market’s rapid price swings can cause symmetrical triangles to resolve more quickly than in traditional markets. The direction of the breakout often provides a strong indication of the next dominant trend.
- Execution Strategy: Wait for a clear and decisive breakout above the upper trendline (for a bullish signal) or below the lower trendline (for a bearish signal), confirmed by increased volume. Place a stop-loss order on the opposite side of the breakout point. Set price targets based on the triangle’s width.
Accumulation and Reversal Patterns: Identifying Major Shifts
These patterns are crucial for traders looking to identify potential turning points in the market, signaling the end of a trend and the beginning of a new one, often driven by institutional accumulation.
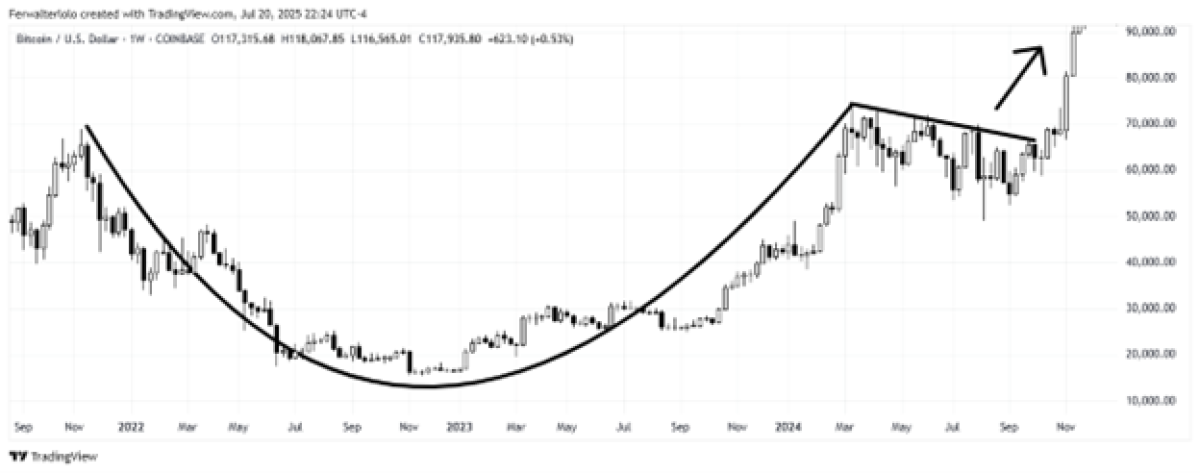
Cup and Handle: A Classic Bullish Accumulation Signal
The cup and handle pattern is widely recognized as one of the most reliable institutional accumulation patterns in financial markets, including cryptocurrencies, boasting an impressive success rate of around 85%. This pattern typically develops over several months and strongly signals bullish continuation. It consists of two parts: the "cup," a rounded bottom formation resembling a teacup, and the "handle," a smaller, downward-sloping consolidation channel that forms after the cup. The breakout from the handle is the key signal for entry. The target for a cup and handle pattern is often the 161.8% Fibonacci extension of the cup’s depth, with potential for extended moves reaching the 261.8% level.
- Key Characteristics: A rounded bottom formation (the cup) followed by a shorter, downward-sloping consolidation (the handle). Volume is typically high during the formation of the cup’s left side, decreases during the rounding, and contracts further in the handle before surging on the breakout.
- Market Context: This pattern indicates a period of accumulation where smart money is quietly buying assets at favorable prices, preparing for a significant upward move. It’s often seen in fundamentally strong cryptocurrencies that are consolidating after a period of growth.
- Execution Strategy: Enter a long position upon a decisive breakout above the resistance level of the handle, accompanied by a significant increase in volume. Place a stop-loss order below the lowest point of the handle or the bottom of the cup. Target the projected Fibonacci extension levels.
High Handle: A Stronger Indicator of Bullish Momentum
The high handle is considered a more potent variant of the cup and handle pattern, maintaining the same high success rate of 85%. Its distinguishing feature is that the handle forms in the upper portion of the cup’s formation, rather than a deeper retracement. This tighter consolidation suggests exceptionally strong underlying demand, as buyers are unwilling to sell at lower prices, thus preventing deeper pullbacks. The compact nature of the high handle often precedes more explosive upward breakouts compared to the standard cup and handle.
- Key Characteristics: Similar to the cup and handle, but the handle forms closer to the rim of the cup, exhibiting less downward slope and tighter price action. This indicates strong buying pressure and limited selling.
- Market Context: This pattern signals exceptional bullish conviction. It suggests that even after a significant price advance and consolidation, buyers are eager to enter the market at current levels, anticipating further gains.
- Execution Strategy: Enter a long position on a strong breakout above the handle’s resistance, ideally with high volume. A stop-loss order should be placed below the low of the handle or the upper rim of the cup. Targets are typically set using Fibonacci extensions.
W-Shape (Double Bottom Variant): Signifying a Trend Reversal
The W-bottom pattern, a bullish reversal pattern with approximately 75% reliability, signals the potential end of a downtrend or a significant correction. This formation is characterized by two distinct troughs at roughly the same price level, separated by a moderate rally. The pattern is confirmed, and a bullish signal is generated, when the price breaks decisively above the peak of the central rally. This breakout often targets the 161.8% Fibonacci extension of the W-shape’s height. W-bottoms frequently mark the conclusion of bear markets or major downward trends, showcasing two phases of accumulation interspersed with a temporary relief rally.
- Key Characteristics: Two distinct lows (bottoms) of approximately equal value, separated by a peak. The pattern is confirmed on a breakout above this intervening peak. Volume typically increases on the breakout.
- Market Context: This pattern suggests that selling pressure is waning, and buyers are stepping in at a support level, failing to break lower on the second test. It indicates a potential shift from a bearish to a bullish sentiment.
- Execution Strategy: Enter a long position once the price breaks and closes above the resistance level formed by the central peak, ideally with increased volume. A stop-loss order should be placed below the lower of the two troughs. Targets can be calculated using Fibonacci extensions.
Flat Base: Institutional Accumulation and Launchpad for Growth
The flat base is a bullish continuation pattern with a strong breakout reliability of around 80%. It is characterized by a period of consolidation where the price trades within a narrow, horizontal range for an extended period, often forming a "launching pad" for the next upward move. This tight price action signifies institutional accumulation, where large players are steadily acquiring assets without significant distribution, indicating strong underlying demand and conviction. Breakouts from flat bases are often sharp and can target the 261.8% Fibonacci extension.
- Key Characteristics: A prolonged period of sideways price action with tight trading ranges, forming a clear horizontal support and resistance. Volume typically contracts during the base formation and surges on the breakout.
- Market Context: This pattern is a strong indicator of accumulation by sophisticated investors. It suggests that a significant asset is being quietly bought up before a substantial price appreciation. It’s common in cryptocurrencies that are establishing themselves as leaders in their respective sectors.
- Execution Strategy: Enter a long position on a decisive breakout above the resistance level of the flat base, accompanied by a significant increase in trading volume. Place a stop-loss order just below the support level of the base. Target Fibonacci extension levels, with the 261.8% extension being a common objective.
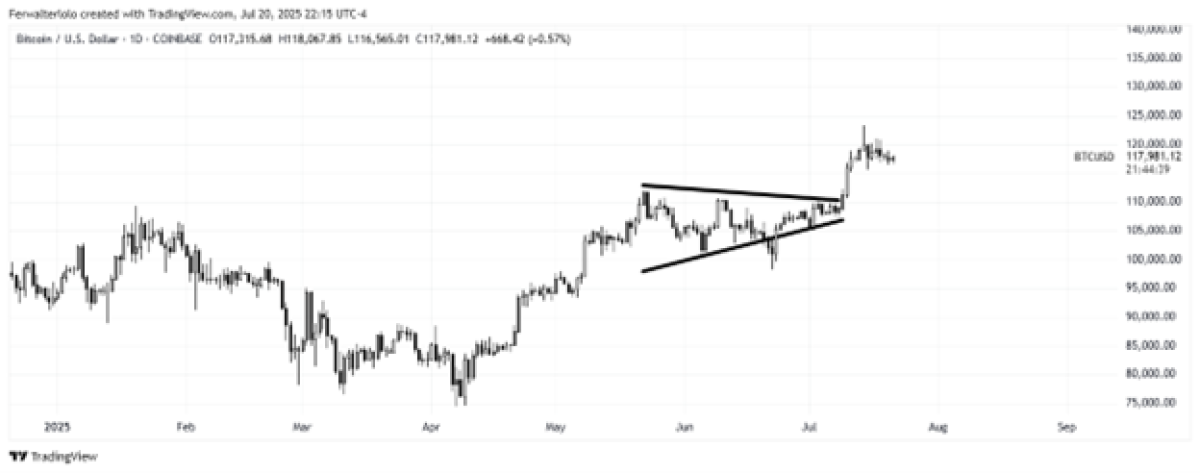
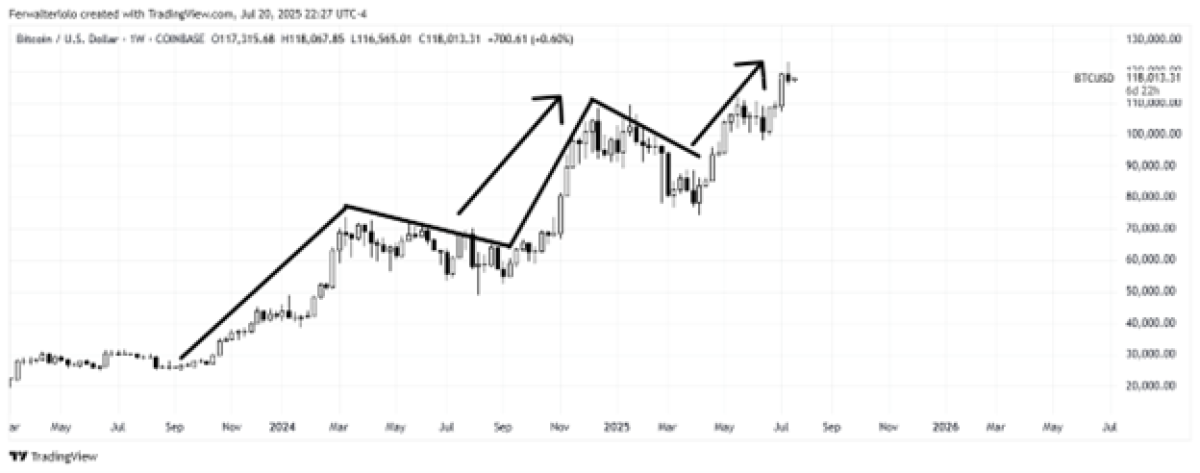
Ascending Base: Steady Accumulation with Upward Bias
The ascending base is a bullish continuation pattern with a high breakout reliability of approximately 80%. It signals steady accumulation, characterized by a series of higher lows over a period of 6-12 weeks, while encountering consistent resistance at a specific level. This pattern indicates that buyers are incrementally willing to pay higher prices for the asset, while sellers remain firm at a particular price ceiling. This persistent buying pressure eventually leads to a breakout. Breakouts from ascending bases often target the 127.2% Fibonacci extension, with secondary targets at 161.8%.
- Key Characteristics: A series of higher lows combined with a consistent resistance level, forming a consolidation pattern with an upward bias. The overall price action is contained within an upward-sloping channel.
- Market Context: This pattern suggests strong underlying demand and accumulation. Buyers are progressively showing more interest, pushing prices up on each dip, while resistance indicates a point where some profit-taking or supply emerges. This tension often resolves with an upward breakout.
- Execution Strategy: Enter a long position on a breakout above the resistance level, confirmed by increased volume. A stop-loss order can be placed below the most recent higher low or the lower trendline of the ascending base. Targets are set using Fibonacci extensions.
Integrating Patterns with Broader Analytical Frameworks
While chart patterns offer invaluable insights, their effectiveness is significantly enhanced when integrated with other analytical methods. This multi-faceted approach minimizes false signals and increases confidence in trading decisions.
Volume Analysis: Volume is a critical confirmation tool for all chart patterns. A breakout accompanied by high volume suggests strong conviction behind the move, while low volume on a breakout can indicate a false signal. For instance, a bullish pennant breakout should ideally occur on increasing volume after a period of contraction within the pennant.
Support and Resistance Levels: Existing support and resistance levels can either reinforce or contradict the signals provided by chart patterns. A bullish ascending triangle breaking above a key resistance level carries more weight than one breaking through a minor hurdle. Conversely, a descending triangle breaking below a significant support level signals a more potent downtrend.
Moving Averages: Moving averages (e.g., 50-day, 200-day) can act as dynamic support and resistance levels and can help confirm the prevailing trend. A bullish pattern forming above key moving averages strengthens its bullish implications, while a bearish pattern forming below them reinforces its bearish outlook.
Fibonacci Retracements and Extensions: As highlighted throughout this series, Fibonacci levels are instrumental in identifying potential entry points, stop-loss levels, and price targets for various chart patterns. They provide a mathematical framework to quantify potential price movements.
Multi-Timeframe Analysis: Examining chart patterns across different timeframes (e.g., daily, weekly, hourly) can provide a more comprehensive understanding of the market. A pattern that appears on a daily chart might be part of a larger, more significant trend on a weekly chart, or it could be a minor consolidation within a larger move on an hourly chart. This helps traders align their strategies with the dominant market forces.
The Importance of Risk Management and Adaptability
The cryptocurrency market’s inherent volatility necessitates robust risk management strategies. No chart pattern, however reliable historically, can guarantee profits. Traders must always employ stop-loss orders to limit potential losses, position size appropriately, and avoid over-leveraging.
Furthermore, the cryptocurrency landscape is constantly evolving. New technologies, regulatory developments, and shifts in market sentiment can rapidly alter the dynamics of trading. Traders must remain adaptable, continuously refine their analytical skills, and be prepared to adjust their strategies in response to changing market conditions. The knowledge of these advanced chart patterns is a powerful addition to a trader’s arsenal, but it is the disciplined application and integration with sound risk management principles that ultimately pave the way for sustained success.
Conclusion: A Toolkit for Tactical Trading
This two-part series has aimed to provide a comprehensive toolkit for analyzing crypto markets across various scenarios, from foundational patterns to more complex formations. Mastering these patterns requires consistent practice, back-testing, and ongoing refinement of technical skills. While no pattern guarantees success, combining multiple signals, understanding the market context, and maintaining realistic expectations significantly enhances decision-making and long-term performance. The journey of a successful trader is one of continuous learning and adaptation, leveraging tools like chart patterns to navigate the dynamic world of cryptocurrency trading with greater insight and confidence.
About the Contributor
Fernando Walter Lolo, CAIA specializes in alternative investments, cryptocurrencies, volatility, and global-macro trading and investment strategies. Fernando has a strong track record to strategize, articulate, and execute investment strategies, financial operations, and trading in developed and emerging markets.
Learn more about CAIA Association and how to become part of a professional network that is shaping the future of investing, by visiting https://caia.org/.
