

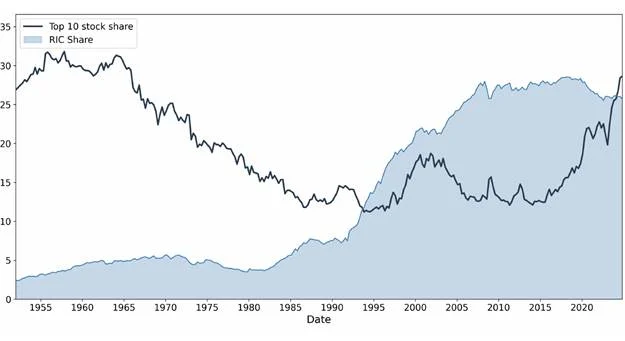
The U.S. stock market has undergone a significant transformation in recent years, characterized by an unprecedented surge in market concentration. This trend, which has seen a handful of mega-cap companies increasingly dominate market capitalization, is now intersecting with long-standing regulatory frameworks governing investment funds, leading to unexpected consequences for fund performance, investment strategies, and ultimately, stock prices. Research from the University of Chicago Booth School of Business, authored by Lubos Pastor, Taisiya Sikorskaya, and Jinrui Wang, sheds light on this complex interplay, particularly focusing on the impact of the 50/5/10 diversification rule on mutual funds and exchange-traded funds (ETFs).
The core of the issue lies in the escalating dominance of a select few stocks. Between 2015 and 2024, the market capitalization share of the ten largest stocks in the U.S. market more than doubled, rising from a modest 13% to a substantial 31%. This concentration is even more pronounced in specific market segments. For instance, in the large-cap growth sector, the share of the top ten stocks surged from 30% to 48% over the same period. By the close of 2024, the group of seven technology giants, colloquially known as the "Magnificent 7," alone accounted for approximately one-third of the S&P 500’s total market value and over half of the Russell 1000 Growth Index. This phenomenon has been a subject of extensive discussion, often framed through the lens of market power and the rise of dominant corporate entities. However, the Chicago Booth research highlights a distinct, yet equally critical, implication: the regulatory constraints imposed on investment funds by this escalating concentration.
The Binding Nature of the 50/5/10 Rule
At the heart of the researchers’ analysis is the 50/5/10 rule, a crucial provision for investment funds seeking to qualify as Regulated Investment Companies (RICs) under the U.S. Internal Revenue Code. To maintain this status, essential for tax efficiency, at least 50% of a fund’s assets must be invested in securities where no single issuer accounts for more than 5% of the fund’s total assets. Furthermore, a fund cannot hold more than 10% of an issuer’s total outstanding voting securities.
Historically, this rule was largely a formality for broadly diversified equity funds. In a market where individual stock weights within major indices were relatively modest, few companies approached the 5% threshold that would necessitate a fund trimming its holdings. However, the dramatic rise in market capitalization of a few mega-cap companies has fundamentally altered this landscape. When these dominant firms represent a significant portion of capitalization-weighted benchmarks, the 50/5/10 rule transforms from a procedural guideline into a meaningful operational constraint.
For fund managers, this presents a complex challenge. Consider a hypothetical scenario where a manager is highly optimistic about a stock like Nvidia, which has become a substantial component of major growth indices. The 50/5/10 rule effectively caps the proportion of Nvidia stock the fund can hold. Overweighting Nvidia beyond the 5% limit would violate the rule, jeopardizing the fund’s RIC status and its associated tax benefits. Consequently, managers may be compelled to hold less of these highly concentrated, and potentially high-performing, stocks than their investment conviction would dictate. This limitation extends to other mega-cap companies as well, as investors face inherent restrictions on the size of their largest single positions. The cumulative effect of these individual constraints can translate into reduced aggregate demand for these dominant stocks.
Quantifying the Impact: Data and Findings
The Chicago Booth research provides empirical evidence illustrating the growing bind of the 50/5/10 rule. The study meticulously analyzed quarterly holdings data for 4,745 U.S. domestic equity funds spanning from the third quarter of 2019 to the fourth quarter of 2024. To gauge the proximity to the regulatory limit, the researchers calculated a "regulatory buffer" for each fund. This buffer is defined as 50% minus the sum of the fund’s large positions (those exceeding the 5% asset threshold). A negative buffer signifies a breach of the rule, while small positive buffers indicate that a fund is operating close to the constraint. Funds with buffers between 0% and 5% were categorized as "constrained."
The findings reveal a stark increase in the number of constrained funds and the assets they manage. In the third quarter of 2019, assets held by constrained funds were "negligible." However, by the fourth quarter of 2024, these assets constituted 6% of total domestic equity fund assets. The constraint reached its peak in the third quarter of 2024, with 171 funds, managing nearly $1.4 trillion (or 8% of total assets), operating under restrictive conditions. The impact is particularly acute within the large-cap growth fund category. In the third quarter of 2024, approximately one-third of these funds were constrained, collectively managing over $1.1 trillion, representing nearly half of the sector’s total assets.
Crucially, the research demonstrates that this constraint is increasingly mediated through market benchmarks. The study applied the same buffer concept to major equity indices and found that index buffers have significantly declined across the board. The decline has been especially precipitous for large-cap growth indices, with buffers approaching zero by 2024. The Nasdaq-100 serves as a prominent illustration. In 2023, the index implemented a special rebalancing designed to reduce the weights of its largest constituents – the Magnificent 7 – precisely to circumvent potential breaches of concentration limits imposed by the 50/5/10 rule.
This benchmark concentration has far-reaching implications for both passive and active funds. Passive funds, by definition, replicate their benchmarks and thus inherit their reduced buffers. Active funds, which often manage their portfolios relative to benchmarks and seek to minimize tracking error, are also indirectly constrained. In a highly concentrated market, the regulatory limits effectively permeate the investment landscape, influencing a broad spectrum of funds beyond just those passively tracking indices.
Fund Behavior and Performance Ramifications
The pressure exerted by the 50/5/10 rule has tangible effects on fund management behavior. As funds approach or breach the regulatory limit, they are compelled to rebalance their portfolios. This typically involves trimming their largest positions and reallocating capital towards smaller-cap stocks. The intensity of this trimming activity appears to correlate with the proximity to the 5% threshold and the volatility of the large positions, suggesting that higher compliance risk drives more aggressive adjustments. Beyond shifting within equity allocations, constrained funds also tend to reduce their overall equity exposure, opting for less volatile assets such as cash to substitute for large equity holdings.

These mandated portfolio adjustments are not without cost. The research indicates that constrained large-cap growth funds exhibit underperformance. Using regressions that control for fund-specific characteristics, the study found that these funds experienced significantly lower risk-adjusted returns in the subsequent six months. Specifically, during the 2019-2024 period, the average four-factor-adjusted return for constrained funds was 57 basis points lower. This underperformance was more pronounced in 2023-2024, coinciding with the period of tightest constraints. Funds that actually breached the 50/5/10 rule (negative buffers) demonstrated even greater underperformance.
Implications for Stock Pricing and Market Efficiency
The underperformance observed in constrained funds raises a critical question: why are they struggling? One compelling explanation, supported by the research, is that these funds are being forced to divest or underweight stocks that subsequently exhibit strong performance. This phenomenon has a direct implication for asset pricing. Analogous to how short-sale constraints can lead to the overpricing of stocks by preventing pessimistic investors from expressing their views, long-position constraints can contribute to the underpricing of stocks by limiting the ability of optimistic investors to fully capitalize on their convictions.
To test this hypothesis, the researchers developed a stock-level metric of "constrained ownership" (denoted as "C"). For each stock and month, this measure quantifies the proportion of outstanding shares held in large positions by funds operating with buffers below 5%. The intuition is that stocks with a positive "C" value may be subject to underpricing because they are likely to be underweighted by constrained funds.
The scope of affected stocks has expanded dramatically. The total market capitalization of stocks with positive "C" values surged from $11 trillion in the third quarter of 2019 to $41 trillion by the fourth quarter of 2024, representing over 60% of the aggregate U.S. market capitalization. Many of these affected stocks are large-cap growth companies, with major players like Nvidia and Microsoft exhibiting "C" values around 5%.
The empirical results align with the underpricing prediction. The "C" measure positively forecasts risk-adjusted returns among large stocks, particularly during the 2023-2024 period when the 50/5/10 constraint was most acute. Over horizons ranging from one to twelve months, stocks with positive "C" values significantly outperformed those with zero "C." At the six-month horizon, cumulative abnormal returns for positive "C" stocks were 2.3% higher. This effect was even more pronounced for high-volatility stocks, which, due to their price fluctuations, pose greater compliance risks for funds.
Trading strategies built around the "C" measure also yield notable results. A value-weighted portfolio composed of high-"C" stocks generated annualized four-factor alphas of 1.7% over the 2019-2024 period and 2.3% during the more constrained 2023-2024 timeframe. A portfolio combining high "C" and high volatility stocks delivered even larger alphas of 7.9% and 11.8%, respectively. While the sample period is relatively short and the statistical significance of these alphas is marginal, the findings are noteworthy given that the affected stocks are among the largest and most liquid in the market.
Active vs. Passive Funds and Evolving Regulations
The distinction between active and passive funds offers further insight into the underlying mechanisms. Both active and passive funds are compelled to trim large positions as they approach or violate the 50/5/10 limit, and both experience performance degradation when constrained. However, the research suggests that constrained ownership by active funds holds greater predictive power for stock returns. This observation aligns with the theoretical framework that the regulatory constraint has a more significant impact on prices when it limits the positions of investors who may possess superior information or hold optimistic views.
Beyond the 50/5/10 rule, the study also examined the 75/5/10 rule, which applies to funds classified as diversified under the Investment Company Act of 1940. While this rule is generally considered "softer" in practice, the researchers found similar, albeit weaker, patterns. Diversified funds nearing the 75/5/10 limit exhibited more aggressive trimming of large positions compared to non-diversified funds, experienced a modest performance drag, and contributed to some degree of return predictability.
Policy Takeaways and Future Considerations
The findings of Pastor, Sikorskaya, and Wang carry significant implications for a range of stakeholders, including regulators, benchmark providers, and market participants. Diversification rules are fundamentally designed to protect investors from excessive concentration risk. However, the research highlights a critical paradox: when capitalization-weighted market benchmarks themselves become highly concentrated, these same diversification rules can inadvertently bind a substantial portion of the fund industry. This can impede funds’ ability to track passive benchmarks, restrict the expression of optimistic investment views, and potentially distort the prices of the largest, most influential companies in the market.
This does not suggest that diversification requirements are inherently undesirable. They play a vital role in investor protection. However, the study underscores that the costs and consequences of these rules are deeply intertwined with the structure of the market. In an environment characterized by a small number of dominant mega-cap stocks, a reassessment of the 50/5/10 rule appears warranted. The central policy question is not whether funds should be diversified, but rather how diversification rules should be calibrated and implemented when the very benchmarks that many funds track have themselves become highly concentrated. This necessitates a nuanced approach, considering the evolving dynamics of market concentration and its impact on regulatory frameworks designed for a different era.
