

The aggregate assets under management for the 17 largest U.S. university endowments have experienced substantial growth, soaring from approximately $249 billion in fiscal year 2016 to an estimated $426 billion by fiscal year 2025. This remarkable increase, representing a gain of roughly 70-73% depending on rounding, is a testament to both robust investment performance and significant new gift contributions. However, a closer examination of these institutional titans reveals a more nuanced narrative than mere aggregate growth suggests. Three distinct allocation philosophies, coupled with markedly different risk profiles, have emerged. Furthermore, a structural efficiency gap becomes apparent when these endowments are benchmarked against their global institutional peers, according to an in-depth analysis drawing on the 2025 NACUBO-Commonfund Study of Endowments, individual fund annual reports, and sophisticated risk modeling from FIS-APT. This comprehensive study offers critical insights into the complex world of endowment management, exploring allocation strategies, risk management, and overall portfolio efficiency.
A Decade of Robust Growth and Divergent Performance
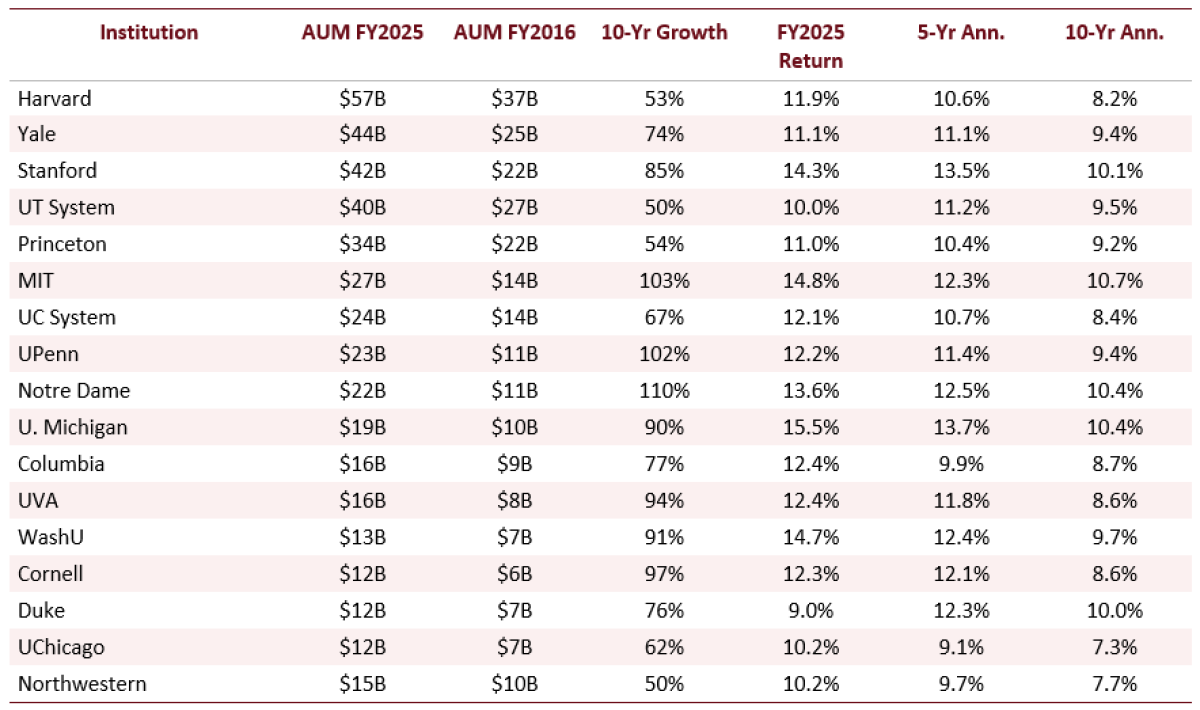
Over the past decade, the landscape of university endowment investing has been characterized by impressive expansion. The collective Assets Under Management (AUM) for the top 17 U.S. university endowments climbed from roughly $247 billion in FY2016 to approximately $426 billion by FY2025, a testament to both astute investment decisions and ongoing donor generosity. While the aggregate figures paint a picture of success, the performance of individual institutions reveals significant divergence.
In FY2025, the University of Michigan emerged as a standout performer, reporting a net return of 15.5%. Following closely were the Massachusetts Institute of Technology (MIT) at 14.8%, Washington University in St. Louis (WashU) at 14.7%, and Stanford University at 14.3%. This strong showing in a single fiscal year, however, does not always translate into sustained long-term leadership.
Examining performance over longer horizons provides a more comprehensive view. Over a five-year period, Michigan, Stanford, Notre Dame, WashU, and MIT have all consistently surpassed 12% annualized returns. The ten-year horizon sees MIT, Michigan, Stanford, Notre Dame, and Duke leading the pack. Notably, Harvard University, despite holding the largest AUM at $57 billion, posted a ten-year return of 8.2%, placing it at the lower end of the top five by asset size. This disparity underscores a critical observation: the best one-year performers are not always the strongest long-term compounders, highlighting the importance of strategic patience and consistent execution in endowment management.

Unpacking Diverse Allocation Philosophies: Harvard, Yale, and Michigan as Case Studies
The top 17 endowments, while unified by their scale, are far from monolithic in their investment strategies. A closer look at three institutions—Harvard, Yale, and Michigan—illuminates the spectrum of philosophical approaches and their associated risk-return profiles. These three universities, each with unique endowments, serve as potent examples of differing philosophies that have shaped their financial trajectories.
Harvard University: The Concentration Model
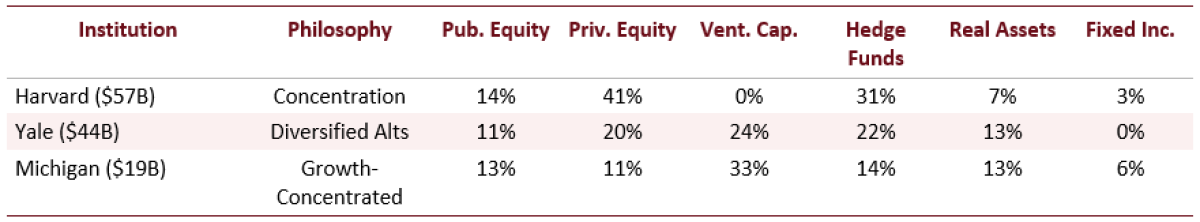
Harvard’s endowment, the largest among the group at $57 billion, exemplifies a concentration model with a pronounced emphasis on private equity and hedge funds. Its portfolio allocation shows approximately 41% in private equity and 31% in hedge funds, with no dedicated allocation to venture capital. This strategy involves accepting significant illiquidity and manager concentration in pursuit of private market return premiums. While Harvard has demonstrated strong recent one-year performance at 11.9%, its ten-year return of 8.2% reflects the costs associated with its earlier strategic transition period and the inherent challenges of managing a highly concentrated portfolio. The long-term impact of such a strategy often involves navigating periods of underperformance as the illiquid assets mature and are realized.
Yale University: The Diversified Alternatives Model
Yale University, under the pioneering leadership of David Swensen, has long been recognized as the originator of the diversified alternatives model. This approach, which has profoundly influenced the broader endowment and institutional investment industry, emphasizes broad diversification across a range of alternative asset classes. Yale’s FY2025 allocation reflects this philosophy, with 24% in venture capital, 20% in private equity, and 22% in hedge funds. This disciplined diversification strategy has historically yielded consistent compounding returns over long horizons, evidenced by its 11.1% one-year performance and a solid 9.4% ten-year annualized return. The Yale model underscores the enduring principle that diversification, when strategically implemented, can lead to more stable and predictable long-term growth.
University of Michigan: The Growth-Concentrated Model
The University of Michigan, the top performer in FY2025 with a 15.5% net return, showcases a growth-concentrated model heavily weighted towards venture capital. Its portfolio includes 33% in venture capital and 11% in private equity, complemented by 13% each in hedge funds and real assets. This strategic posture has translated into a compelling 13.7% five-year and 10.4% ten-year annualized return. Michigan’s success demonstrates that a concentrated focus on high-growth areas, when executed effectively across multiple market cycles, can yield exceptional long-term results. This is not a strategy dependent on a single year’s market fluctuations, such as those driven by AI-related valuations, but rather a durable approach built over time.
These three distinct approaches highlight that there is no single, universally applicable path to achieving long-term outperformance in endowment management. Each strategy carries its own set of risks and rewards, necessitating careful consideration of an institution’s specific objectives, risk tolerance, and operational capabilities.
Diversification: The Nuances of Real Assets and Hedge Funds
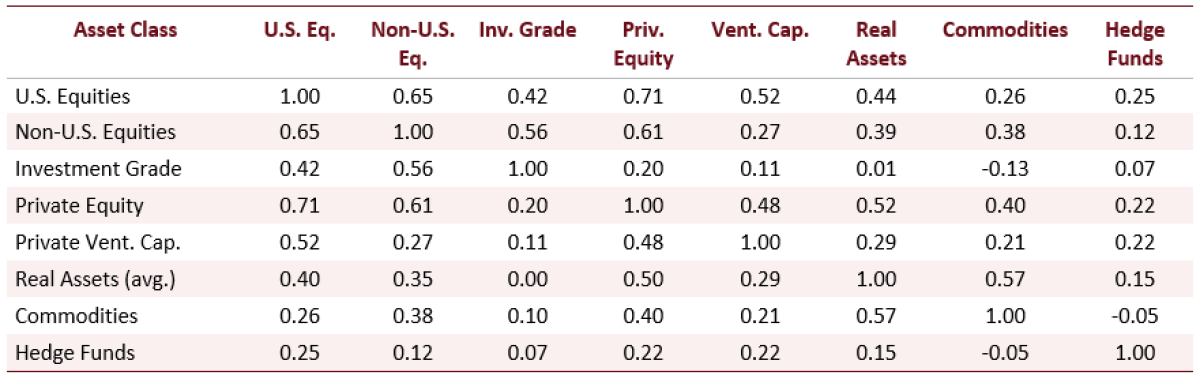
While the broad embrace of alternative investments by large endowments suggests a sophisticated approach to diversification, the reality is that not all alternatives contribute to risk reduction in the same manner. An analysis of selected ex-ante correlation estimates from the FIS-APT model reveals critical distinctions, particularly between private equity and hedge funds, which offer significant implications for portfolio construction.
The APT model’s correlation estimates, while presented as a selected summary due to the composite nature of "Real Assets," clearly differentiate asset classes. Private equity exhibits a correlation of 0.71 with U.S. equities, and venture capital shows a correlation of 0.52. These figures indicate that both asset classes retain a meaningful exposure to equity beta. Similarly, real estate and private energy investments carry comparable risk exposures to public equities.
In stark contrast, hedge funds, as modeled by the Global HFR Index, demonstrate a much lower correlation with U.S. equities (0.25) and even lower with non-U.S. equities (0.12). Commodities, another alternative asset class, show a negative correlation (-0.05) with hedge funds. This divergence is a key driver of observed portfolio behavior. Even in portfolios with over 60% allocated to alternatives, approximately 86% of the ex-ante volatility across large endowments still originates from the equity factor. This suggests that endowments have not eliminated equity risk but have instead shifted its manifestation towards manager selection skill, timing of valuations, and the inherent illiquidity of alternative investments.
Risk Profiles and Risk-Adjusted Efficiency: A Global Perspective
When assessed through the lens of risk-adjusted performance, the leading U.S. endowments present a compelling yet complex picture. The largest 17 endowments, categorized as the "Over $5B" cohort, consistently outperform their U.S. and Canadian pension fund peers over one-year, five-year, and ten-year horizons, with average returns of 12%, 11%, and 9% respectively. However, this outperformance comes at the cost of higher ex-ante risk, estimated at approximately 11%, and a greater potential for losses, with around 20% expected in a one-in-20-year event.
The critical metric of risk-adjusted returns reveals a notable efficiency gap. The Sharpe Ratios for the "Over $5B" cohort stand at 0.56, and their Information Ratios are 0.76. These figures are significantly lower than those of the Canadian "Maple 8" benchmark group, which achieves a Sharpe Ratio of 0.90 and an Information Ratio of 1.43.
Delving deeper, the Sharpe Ratio range across the 17 U.S. endowments spans from 0.38 for WashU to 0.74 for the University of Texas System. This contrasts sharply with the Maple 8’s benchmark Sharpe Ratio of 0.90. WashU’s ten-year ex-post volatility, at 19.5%, is the highest in the group. This elevated volatility explains how a competitive ten-year return of 9.7% translates into a relatively low Sharpe Ratio. Conversely, Cornell and Columbia Universities, despite lower headline returns, exhibit the lowest ex-ante volatility within the individual endowment group at 9.1% and 9.6% respectively, and consequently achieve above-average Sharpe Ratios relative to their peers with higher reported returns. The Maple 8’s Information Ratio of 1.43, compared to the "Over $5B" cohort’s 0.76, represents the most stark quantitative expression of this efficiency disparity.
Stress Testing Portfolios: The Enduring Influence of Equity Risk
The ability of an investment portfolio to withstand market shocks is a crucial measure of its resilience. Even with significant allocations to alternative assets, stress tests reveal that equity factor risk remains the dominant driver of volatility and potential losses for large U.S. endowments. Approximately 86% of ex-ante volatility across these endowments can be attributed to equity factors, underscoring the persistent influence of public market movements.
During the COVID-19 pandemic scenario (March-April 2020), most endowments experienced losses in the range of 21-27%. This widespread impact highlights the limitations of alternative investments in fully offsetting rapid, global liquidity events driven by broad equity market sell-offs.
However, when faced with an inflationary environment akin to early 2022, endowments demonstrated a degree of resilience compared to their pension fund counterparts. The "Over $5B" cohort experienced losses of approximately 8%, while benchmark portfolios lost between 22-25%. This comparative advantage in inflationary periods is attributed to the inclusion of real assets and certain hedge fund strategies, which can offer a partial hedge against rising prices.
Several specific findings emerge from these stress tests:
- Notre Dame’s Equity Concentration: Notre Dame’s portfolio exhibited a 96% equity factor attribution, resulting in a stagflation loss of -18.1%. This reflects its significant exposure to public equities.
- Duke’s Commodity Exposure: Duke University’s 11.7% allocation to commodities, the highest among its peers, contributed to a more modest stagflation loss of -4.3%. This exposure, particularly in energy and natural resources, provided a notable inflation hedge.
- Maple 8’s Fixed Income Exposure: The Canadian Maple 8 benchmark group’s 7.0% duration factor attribution, significantly higher than most endowments, is a result of their greater fixed income exposure, often achieved through leverage. While this contributes to lower overall volatility, it also leads to larger mark-to-market losses during sharp interest rate increases, as seen in their -10.0% stagflation loss.
- UC System and Public Pensions: The University of California System and Notre Dame experienced substantial stagflation losses (-15.7% and -18.1% respectively), directly linked to their high equity factor concentrations. Similarly, U.S. Public Pensions, despite mandatory fixed income allocations, also faced significant mark-to-market losses during periods of rising rates.
Key Takeaways for Investment Professionals and Future Directions
The comprehensive analysis of the top U.S. university endowments offers several critical insights for investment professionals navigating complex market environments.
Raw Returns Require Volatility Adjustment
A fundamental lesson is that comparing raw returns in isolation can be misleading. While WashU’s ten-year return of 9.7% and Cornell’s 8.6% appear comparable, WashU’s ex-ante volatility of 14.1% stands in stark contrast to Cornell’s 9.1%. Cornell’s more disciplined approach, as evidenced by its higher Sharpe Ratio, demonstrates a more efficient outcome for the level of risk assumed. Table 4 explicitly illustrates this risk-adjusted performance across all 17 institutions, underscoring the necessity of evaluating returns within the context of volatility.
Factor Attribution as a Predictive Tool
The analysis underscores that factor attribution provides a more granular and predictive understanding of stress-test outcomes than simple allocation labels. Institutions with similar allocations to alternatives can exhibit vastly different equity factor shares. This equity share, in turn, emerges as the primary determinant of losses during significant market downturns like the Financial Crisis and the COVID-19 pandemic. Furthermore, specific exposures to real assets and commodities, particularly in energy, natural resources, and infrastructure, proved crucial in differentiating stagflation outcomes during the 2022 inflationary period.
Structural Differences with Global Peers
A key finding is that the success of global peers like the Maple 8 is not merely a matter of strategic asset allocation but also reflects structural differences in their approach. While U.S. endowments primarily utilize real assets and hedge funds to diversify away from equity markets, the Maple 8 employs leverage—through debt, repo markets, and derivatives—to achieve diversification, notably in fixed income. Both strategies enhance risk-adjusted returns compared to traditional portfolios, but they employ distinct mechanisms with divergent risk profiles. The Maple 8’s superior Sharpe Ratio (0.90 vs. 0.56) and Information Ratio (1.43 vs. 0.76) suggest that closing this efficiency gap would require U.S. endowments to consider balance sheet leverage and direct investment infrastructure, elements that current governance structures may not readily support.
The ongoing evolution of the endowment landscape, driven by factors such as increasing AUM, evolving market dynamics, and the pursuit of superior risk-adjusted returns, will undoubtedly continue to shape these strategies. As institutions grapple with the complexities of generating sustainable long-term growth, the lessons learned from the top U.S. university endowments offer invaluable guidance for investment committees, asset allocators, and fiduciaries worldwide. The pursuit of both robust returns and capital preservation in an increasingly uncertain global economy remains the paramount challenge.
