

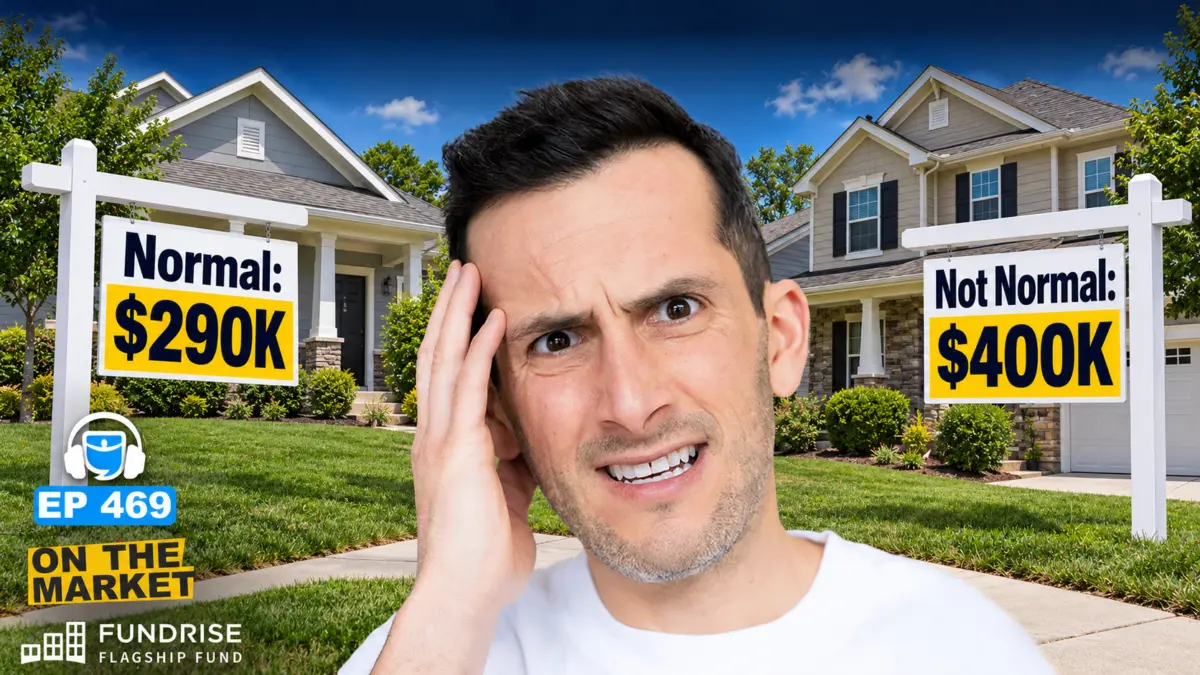
The United States housing market is currently grappling with a fundamental disconnect between property values, interest rates, and household earnings, creating a period of stagnation that experts suggest could persist for the better part of a decade. While the post-pandemic era was characterized by a rapid escalation in home prices fueled by historically low interest rates, the subsequent correction has been slow and painful. Current data indicates that the housing market is unlikely to return to "normal" affordability levels in the short term, with mathematical models suggesting a recovery timeline ranging from five to twenty years depending on various economic levers.
To understand the severity of the current situation, one must define the metrics of a "normal" market. Historically, housing affordability is measured by the payment-to-income ratio—the percentage of a household’s gross income required to cover a monthly mortgage payment on a median-priced home. From 1989 to the present, the long-term average for this ratio has hovered around 18.5%. In the final quarter of 2019, immediately preceding the global pandemic, the ratio was even more favorable at 15.6%. However, as of late 2024, that figure has spiked to approximately 24.6%, with some estimates pushing toward 27% when accounting for the most recent interest rate fluctuations. This shift represents a nearly 10% increase in the share of income dedicated to housing compared to the previous decade’s norm.
The Three Pillars of Affordability
The path toward a balanced housing market relies on three primary economic levers: wage growth, mortgage rates, and home prices. For affordability to improve, at least one of these variables must shift significantly, or a combination of all three must move in tandem.
The Wage Growth Gap
In an ideal scenario, rising incomes would allow Americans to absorb higher housing costs. However, the mathematical requirements for wages to solve the affordability crisis alone are staggering. To return to the long-term affordability average of 18.5%, real wages—which are adjusted for inflation—would need to rise by approximately 33%. To return to 2019 levels of affordability, a 57% increase in real wages would be required.
Historical context provides a sobering perspective on these figures. Since 1968, the average annual growth for real median wages in the United States has been a mere 0.8%. At this historical pace, it would take nearly 60 years for wage growth alone to restore 2019-level affordability. Furthermore, current economic trends show that real wage growth has occasionally turned negative as inflation outpaces nominal pay raises. The rise of automation and artificial intelligence also presents a potential headwind for high-paying service-sector jobs, suggesting that a wage-led recovery is the least likely solution to the housing impasse.
The Interest Rate Ceiling
The most volatile component of the affordability equation is the mortgage rate. The transition from 3% mortgage rates in 2021 to over 7% in 2024 has effectively doubled the monthly carrying cost for new buyers. For mortgage rates alone to restore 2019 affordability levels, they would need to drop to approximately 2.7%.
Financial analysts and Federal Reserve observers largely agree that the era of sub-3% rates was an anomaly driven by emergency monetary policy and is unlikely to return in the foreseeable future. Even reaching a 4% rate—which would align the market with the long-term affordability average—would require a significant victory over inflation. The Federal Reserve remains committed to a 2% inflation target, but with the Consumer Price Index (CPI) showing persistence in service-sector costs and energy, mortgage rates are projected to remain in the 6% to 7% range for an extended period.
The Price Correction Paradox
The third lever is home prices. For prices alone to restore the 18.5% affordability benchmark, the national median home price would need to fall by roughly 25%. To reach 2019 levels, a crash of 36% would be necessary.
While a correction of this magnitude occurred during the Great Financial Crisis (GFC) of 2008, the current market fundamentals are drastically different. During the 2008 crisis, the market was flooded with subprime debt and a massive surplus of inventory. Today, the "lock-in effect" has created an inventory drought. Approximately 80% of current mortgage holders have rates below 6%, and 50% have rates below 4%. These homeowners are financially disincentivized from selling, as moving would mean trading a low-interest loan for a much more expensive one. Without a surge in forced selling—which is unlikely given that delinquency rates remain near historic lows—a massive national price crash remains improbable.
Historical Chronology and the "Great Stall"
The current market state is the result of a specific sequence of events starting in 2020. The pandemic-induced shift to remote work and a desire for more space led to a surge in demand, while the Federal Reserve’s decision to lower the federal funds rate to near-zero levels made borrowing cheaper than ever. Between 2019 and 2024, national home prices rose by an average of 63%, while family incomes rose by only 37%.
By 2022, the Federal Reserve began an aggressive series of rate hikes to combat inflation, which had reached 40-year highs. This created the "Great Stall" of 2023 and 2024. Transaction volumes plummeted as both buyers and sellers retreated from the market. Unlike the 2008 crash, which was a "fast" correction characterized by foreclosures, the 2024 market is a "slow" correction where prices remain sticky while affordability continues to deteriorate.
Modeling the Recovery: Three Scenarios
Using current data, analysts have modeled several paths forward to determine when the housing market might once again become accessible to the average American earner.
- The Base Case (7-Year Recovery): In this scenario, mortgage rates stabilize at approximately 6%, home prices remain flat (effectively declining in real terms when adjusted for inflation), and wages grow at a steady 3.5% annually. Under these conditions, it would take seven years for the market to return to the 18.5% long-term affordability average.
- The Stagnation Case (20-Year Recovery): If mortgage rates remain slightly higher, around 6.6%, and wage growth is more muted, the timeline for recovery extends to two decades. This scenario assumes that the structural shortage of housing continues to provide a floor for prices, preventing any meaningful nominal decline.
- The Optimistic Correction (5-Year Recovery): This scenario assumes a mild recession that forces mortgage rates down to 5.5% or 6%, coupled with a modest nominal price decline of 2% per year for several years. Even with these favorable shifts, the market would still require five years to reach a state of "normal" affordability.
Broader Economic Impact and Implications
The prolonged lack of housing affordability has wide-ranging implications for the broader U.S. economy. High housing costs act as a "tax" on consumer spending, as households are forced to allocate a larger portion of their disposable income to shelter. This can lead to decreased demand in other sectors, such as retail, travel, and automotive.
Furthermore, the affordability crisis is exacerbating the generational wealth gap. Older homeowners who locked in low prices and low rates are seeing their equity grow, while younger prospective buyers are being pushed into a rental market that is also seeing upward pressure. This lack of mobility prevents workers from moving to high-productivity cities, potentially slowing national GDP growth.
For real estate investors, the strategy has shifted from relying on market appreciation to focusing on "value-add" opportunities and buying below market value. Experts suggest that in a stagnant market, the only way to achieve significant returns is through forced appreciation—improving a property to increase its value—rather than waiting for the general market tide to rise.
Conclusion: A New Era of High Housing Costs
The mathematical reality of the 2024 housing market suggests that the "American Dream" of affordable homeownership is facing its most significant challenge in forty years. The convergence of high prices, elevated interest rates, and stagnant real wages has created a structural barrier that cannot be easily dismantled.
While regional corrections are possible—particularly in "Sunbelt" markets like Austin, Texas, or parts of Florida where inventory is rising—a national return to the affordability of the 2010s appears years, if not a full decade, away. Stakeholders, from policymakers to first-time buyers, must prepare for a prolonged period where housing consumes a historically high percentage of the American paycheck. The "normal" of the future may simply be less affordable than the "normal" of the past.
