

The landscape of executive compensation for U.S. public companies, as revealed by the 2026 proxy season disclosures, showcases a continued evolution toward equity-driven pay, with compensation packages becoming increasingly differentiated by company scale. This comprehensive analysis, drawing on extensive data from the Russell 3000 and S&P 500 indices, highlights key trends in CEO pay, compensation elements, the representation of women in leadership, named executive officers (NEOs), say-on-pay voting, incentive design, perquisites, and the evolving regulatory environment. A dominant theme emerging from this year’s filings is heightened investor scrutiny, particularly focused on exceptional awards, above-target incentive outcomes, and arrangements like executive security.
The data presented for the 2026 proxy season primarily reflects fiscal year 2025 compensation. It’s crucial to understand that reported compensation figures, especially for equity awards, are based on grant-date fair value. This accounting estimate does not represent the actual cash an executive receives or the ultimate value realized, which is subject to vesting schedules, performance conditions, and subsequent stock price fluctuations. Therefore, headline figures should be interpreted with this distinction in mind, as they are not indicative of realized pay.
CEO Compensation Trends: A Steady Ascent Amidst Economic Currents
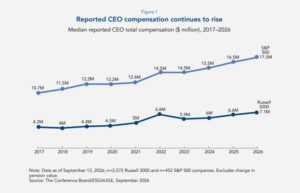
Median reported CEO compensation saw a notable increase in 2026 filings. For companies within the Russell 3000 index, the median reached $7.1 million, a 7% rise from the previous year. Similarly, S&P 500 CEOs reported a median compensation of $17.5 million, marking a 6% increase. This upward trajectory is even more pronounced when viewed over a longer timeframe. In 2017, the corresponding median compensations were $4.2 million for the Russell 3000 and $10.7 million for the S&P 500. By 2026, these figures represent an impressive 68% and 63% increase, respectively. While the Russell 3000 experienced some volatility, including a surge in 2022 followed by a correction in 2023, the overarching trend remains one of consistent growth.

This recent increase occurred against a backdrop of a generally supportive economic environment for incentive compensation. In 2025, real U.S. GDP grew by 2.1%, and corporate profits from current production saw an increase of $275.7 billion. Consumer inflation concluded the year at 2.7%. While these macroeconomic indicators provide context, they do not directly dictate executive pay decisions, and the grant-date equity values should not be conflated with subsequent stock market performance. The persistent S&P 500 premium remains substantial, with the median S&P CEO earning approximately 2.5 times the reported compensation of their Russell 3000 counterpart.
CEO Compensation by Company Size: A Clear Differentiator
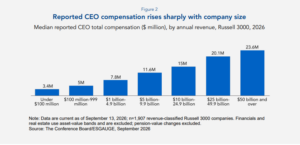
Company size emerges as one of the most significant factors influencing CEO compensation. Within the Russell 3000, median reported pay varied dramatically with revenue. Companies generating less than $100 million in annual revenue reported a median CEO compensation of $3.4 million, starkly contrasting with the $23.6 million median for companies with revenues of $50 billion or more – a near sevenfold difference.
This disparity is not merely a matter of scale but also reflects a shift in pay mix. In the smallest revenue cohort, salary constituted 24% of the compensation package, whereas in the largest cohort ($50 billion+), it accounted for only 8%. Combined salary and other cash compensation represented approximately 36% for smaller companies and 25% for larger ones. This indicates that larger corporations not only award higher absolute compensation but also allocate a greater proportion of the package to equity and long-term incentives. Consequently, a broad index-wide median can be an inadequate substitute for a well-constructed peer group analysis, as highlighted by Vanguard’s voting policy, which emphasizes the appropriateness of compensation peers and target compensation relative to market benchmarks.
CEO Compensation by Sector: Shifting Dynamics and Nuances
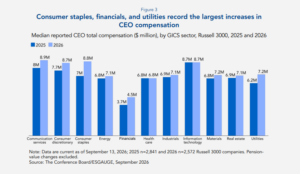
The communication services sector led the Russell 3000 in median CEO compensation for the 2026 cohort, reaching $8.9 million. Closely following were consumer staples, information technology, and consumer discretionary, with figures ranging from approximately $8.7 million to $8.8 million. The most significant year-over-year increases were observed in consumer staples (up 25%), financials (up 22%), and utilities (up 16%). Consumer discretionary and communication services also saw healthy gains of 13% and 12%, respectively, while information technology and healthcare remained relatively flat.
However, these sector-specific increases warrant a cautious interpretation. Sector cohorts are not static, with changes in company participation affecting median figures. For instance, the consumer staples sector saw a decline in its representation from 120 companies in 2025 to 91 in 2026. Similarly, financials and utilities experienced reductions in their cohort sizes. Furthermore, grant timing and individual award decisions can disproportionately influence sector medians. While these figures offer a snapshot of the current disclosure cohort, they should not be extrapolated as uniform pay increases across all CEOs within a sector. The pronounced variation in pay by company size, as depicted in Figure 2, suggests that organizational scale is a more potent determinant of CEO compensation than sector alone.
Exceptional Awards Dominate the Apex of Reported CEO Pay
At the extreme upper end of reported CEO compensation, figures often represent significant outliers, driven by unusual long-duration awards or specific accounting events rather than conventional annual pay. For example, Tesla’s reported CEO compensation of $158.4 billion includes the maximum grant-date value of a highly contingent performance award and a component that was later forfeited. Welltower’s $821.1 million figure reflects a compensation package front-loaded to cover a decade, designed to replace most annual cash and equity incentives. Other substantial awards at companies like Rivian Automotive ($402.6 million) and Wayfair ($280.8 million) are similarly tied to multiyear retention, performance objectives, or strategic transitions, deviating from typical annual compensation cycles.
These substantial awards underscore the critical importance of transparency and justification for compensation committees. Boards are increasingly expected to clearly articulate the time period covered by such awards, the performance conditions required for vesting, the rationale behind the award’s magnitude, and why the standard compensation program was insufficient to achieve the desired outcomes. The practice of reporting grant-date fair value, while mandated by accounting rules, can create a significant disconnect from realized pay, making detailed explanations of award structures paramount for investor understanding and approval.
CEO Compensation Elements and Pay Mix: A Shift Towards Equity
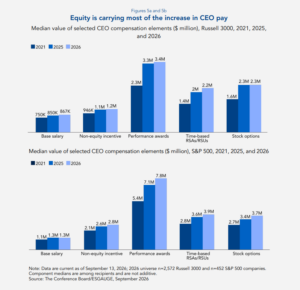
The rise in reported CEO compensation over recent years has been predominantly fueled by equity and incentive awards, rather than base salary increases. Since 2021, median base salaries have seen a modest increase of approximately 16% across both the Russell 3000 and S&P 500 indices. In contrast, the median value of performance awards has surged by 51% in the Russell 3000 and 46% in the S&P 500 during the same period. Time-based restricted stock awards (RSAs) and restricted stock units (RSUs) have also seen substantial growth, increasing by 57% and 38%, respectively, while nonequity incentive compensation has grown by 22% and 31%.
The constrained growth in base salary is attributed to its fixed nature, which increases ongoing compensation obligations. Equity awards, conversely, offer compensation committees greater flexibility to enhance potential value while retaining crucial vesting and performance-based conditions. This shift has a profound impact on how headline compensation is perceived. With equity forming a larger share of the package, reported compensation is increasingly shaped by the grant-date valuation of these awards, rather than fixed cash payments. This necessitates a careful consideration of grant timing and award design when comparing compensation year-over-year, as realized value can ultimately diverge significantly from initial valuations.
Trends in Women CEOs: Gradual Progress, Persistent Gaps
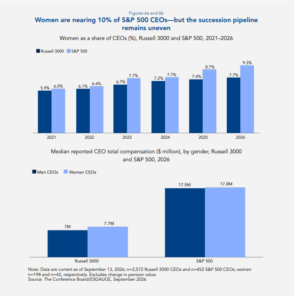
The representation of women in CEO positions within U.S. public companies continues to show steady, albeit slow, progress. In 2026, women held 7.7% of CEO roles in the Russell 3000 and 9.3% in the S&P 500, an increase from 5.9% and 6% in 2021, respectively. While this upward trend is encouraging, women still occupy fewer than one in ten CEO positions.
The picture for other named executive officers (NEOs) reveals a more diverse landscape. Women accounted for 19.6% of non-CEO NEOs in the Russell 3000 and 20.3% in the S&P 500, up from 16% and 16.1% in 2021. However, the distribution across specific functional roles remains uneven. Women hold a significant majority of Chief Legal Officer (CLO) and Chief Human Resources Officer (CHRO) positions, accounting for 34.1% and 37.2% of CLOs, and 67% and 63.8% of CHROs in the Russell 3000 and S&P 500, respectively. Conversely, their representation in Chief Financial Officer (CFO) and Chief Operating Officer (COO) roles, often considered traditional pathways to the CEO position, remains lower at 15.7% and 17% for CFOs, and 16% and 14.4% for COOs. This disparity in representation in critical operational and financial leadership roles has a direct impact on the pipeline for future CEO appointments.
Interestingly, current CEO compensation appears to be largely equitable between men and women in the S&P 500, with median reported compensation at approximately $17.8 million for women and $17.5 million for men. In the Russell 3000, the figures are around $7.7 million for women and $7.0 million for men. It is important to note that these are unadjusted comparisons and do not account for critical factors such as company size, sector, executive tenure, grant timing, or other performance-related variables that influence pay levels.
NEO Compensation Trends: Broad-Based Growth in Equity
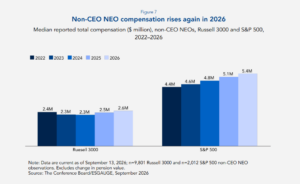
Compensation for non-CEO NEOs has also seen consistent growth. In 2026, median compensation for this group rose by 5% to $2.6 million in the Russell 3000 and by 5% to $5.4 million in the S&P 500. Over the longer term, since 2022, the S&P 500 median has increased by 22%, outpacing the 9% growth observed in the Russell 3000.
Similar to CEO pay, equity awards have been a significant driver of this long-term increase for NEOs. Since 2021, median NEO salaries have increased by 16% in the Russell 3000 and 13% in the S&P 500. Performance award values have seen substantial gains, rising by 51% and 43%, respectively, while RSA/RSU values have increased by 48% and 34%.
Among major functional roles, COOs and CFOs generally command the highest median compensation. In 2026, COO compensation stood at approximately $2.9 million in the Russell 3000 and $6.4 million in the S&P 500, while CFO compensation was $2.6 million and $6.1 million, respectively. These comparisons can vary significantly based on company size and the precise definition of the role. Caution is advised when analyzing data for certain functional roles, such as Chief Marketing Officers in the S&P 500, where the sample size in 2026 was limited to just 27 executives. The prevailing large-company pay premium observed for CEOs extends across much of the senior executive team.
Say-on-Pay and Investor Scrutiny: Strong Support Amidst Targeted Concerns
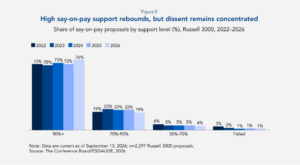
Shareholder support for executive compensation proposals, as measured by "say-on-pay" votes, strengthened in 2026. A notable 76% of Russell 3000 proposals received at least 90% support, an increase from 72% the previous year. Only 20 proposals, representing 0.9% of the sample, failed to achieve majority support. Similarly, in the S&P 500, 73% of proposals garnered at least 90% support, with 1.1% failing.
Sector-specific results show considerable variation. Utilities (91%) and energy (90%) companies demonstrated exceptionally high levels of shareholder approval for their compensation plans. In contrast, communication services and information technology sectors saw lower approval rates, with 57% and 66% of proposals, respectively, receiving at least 90% support. Approximately 10% of proposals in both the communication services and information technology sectors received less than 70% support.
Several instances of weak shareholder votes were directly linked to unusually large or distinctive awards. Warner Bros. Discovery, for example, experienced a mere 15.6% support after reporting $165.0 million in CEO compensation, which included a special stock option award. Aon saw 38.4% support following the granting of a $50 million target-value performance stock unit (PSU) award to its CEO, contingent on an employment extension through 2030. Thermo Fisher Scientific and Snowflake also faced significant shareholder dissent due to atypical CEO compensation decisions. While the specific circumstances surrounding each award differ, these cases collectively highlight a pattern where compensation outcomes deviating from ordinary annual practices face heightened investor scrutiny.
The data suggests that pay levels alone are not the primary driver of broad shareholder opposition. The performance context and the justification for awards are crucial. Investors are increasingly concentrating their scrutiny on exceptional awards that are difficult to explain or appear incongruent with shareholder returns. This leads to pointed questions regarding the necessity of such awards, the rigor of their vesting conditions, and the adequacy of the regular compensation program.
Investor and Proxy Advisor Scrutiny: A Longer Lens on Performance
The improvement in say-on-pay results coincides with a trend towards longer assessment horizons in certain external pay-for-performance frameworks. For the 2026 season, Institutional Shareholder Services (ISS) extended several elements of its U.S. quantitative assessment from three years to five. Glass Lewis has also shifted its North American framework towards a five-year evaluation across a broader spectrum of pay and performance metrics. While institutional investors retain their independent voting discretion, and proxy advisor models should not dictate compensation design, this extended assessment period means that exceptional awards can remain under scrutiny for a longer duration, even years after their initial grant.
Compensation committees can anticipate a range of questions from investors, particularly concerning the alignment of pay with performance, the rationale behind exceptional awards, the rigor of incentive targets, and how shareholder dissent is addressed. These questions reflect a sophisticated investor base that demands clear explanations for compensation decisions, especially those that fall outside the norm.
Incentive Plan Design Trends: Embracing Performance and Equity
Long-Term Incentive Award Mix: A Move Towards Performance Shares
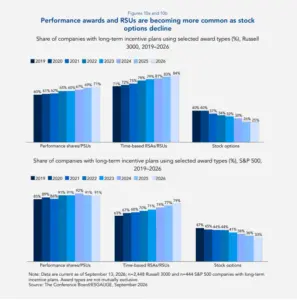
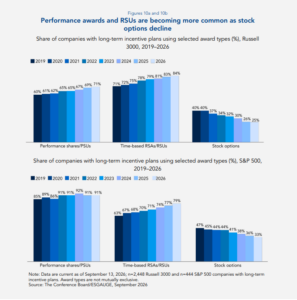
The trend towards performance-based equity awards continues to gain momentum. In the Russell 3000, the use of performance shares/PSUs increased from 60% in 2019 to 71% in 2026. Time-based RSAs/RSUs also saw significant growth, rising from 71% to 84%, while stock options experienced a decline from 40% to 25%.
The S&P 500, already operating with a higher prevalence of performance awards, saw PSU usage rise from 85% in 2019 to 91% in 2026. Time-based RSAs/RSUs also saw substantial adoption, increasing from 63% to 79%, with stock options decreasing from 47% to 33%. A growing number of companies are now combining performance-based awards with time-based stock grants. In 2026, 54% of Russell 3000 companies and 51% of S&P 500 companies with long-term incentive plans utilized this hybrid approach, up from 35% and 34% in 2019, respectively. This strategy allows boards to maintain a strong performance component while simultaneously providing more predictable retention and ownership value. The standard performance measurement period for these awards remains three years, employed by 85% of Russell 3000 plans and 95% of S&P 500 plans.
Annual Incentive Plan Design and Payouts: Stability in Design, Strength in Payouts
Annual incentive plan design remained largely consistent in 2026. Formulaic plans were utilized by 88% of Russell 3000 companies and 93% of S&P 500 companies. Profitability continued to be the dominant financial metric, featuring in 88% and 91% of these plans, respectively. The most common maximum payout structure remained at 200% of target, employed by 60% of Russell 3000 plans and 73% of S&P 500 plans.
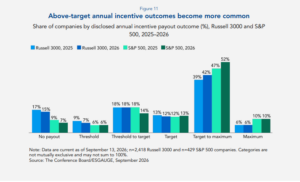
Payout outcomes, however, showed more significant shifts. The proportion of target-to-maximum payouts increased from 39% to 42% in the Russell 3000 and from 47% to 52% in the S&P 500. Maximum payouts remained relatively stable at 6% in the Russell 3000 and 10% in the S&P 500. No-payout outcomes declined from 17% to 15% in the Russell 3000 and from 9% to 7% in the S&P 500. The robust corporate profits in 2025 are consistent with these stronger annual incentive payouts, particularly given the prevalence of profit-based metrics in plan design. Widespread above-target payouts also elevate the importance of the initial goal-setting process. Even when a formula operates as intended, an unconvincing result can emerge if the initial targets were not sufficiently demanding.
CEO Perquisites and Other Benefits: Security Emerges as a Key Focus
While most perquisites and other benefits remain relatively modest compared to overall salary and equity, certain areas are attracting increased attention and significant cost. Median reported perquisites and other compensation were approximately $59,000 for Russell 3000 CEOs and $301,000 for S&P 500 CEOs.
Sharper disparities are evident in specific categories. Nonqualified deferred compensation (NQDC) and supplemental executive retirement plan (SERP) arrangements were reported for 23% of Russell 3000 CEOs and 44% of S&P 500 CEOs. Personal use of corporate aircraft was reported for 17% and 48%, respectively. Most notably, personal and home security provisions were disclosed for 11% of Russell 3000 CEOs and 34% of S&P 500 CEOs. This gap in security provision becomes even more pronounced with increasing company size.
Personal and Home Security: A Growing Business Risk
The heightened visibility of risks to senior corporate leaders has amplified attention on executive security. The tragic killing of UnitedHealthcare CEO Brian Thompson in December 2024 served as a stark reminder of these evolving threats. For corporate boards, executive protection is increasingly viewed not merely as an employee benefit but as a critical business-risk management and duty-of-care issue.
In this context, disclosures related to CEO security have risen sharply. Personal and home security was reported for only 4% of Russell 3000 CEOs and 14% of S&P 500 CEOs in 2021, escalating to 11% and 34% by 2026. Within the S&P 500 alone, the prevalence climbed from 18% in 2024 to 25% in 2025, and then to 34% in 2026. The median disclosed cost among current recipients was approximately $68,600 in the Russell 3000 and $101,900 in the S&P 500. At the higher end, the 20 largest executive security observations in the Russell 3000 averaged around $4.3 million, with a significant concentration in information technology, communication services, and financial sectors. These exceptional cases, such as $12.6 million for Stephen Schwarzman at Blackstone and $8.8 million for Sundar Pichai at Alphabet, underscore the significant investments made in executive protection.
While these represent extreme cases, they illustrate the increasing necessity for boards to clearly delineate what is provided for business and security reasons versus what constitutes a personal benefit. Transparent disclosure and periodic review of these arrangements are essential. The broader market trend is the rapid proliferation of security provisions themselves, rather than the handful of multi-million-dollar disclosures.
The impact of company size on security provisions is particularly evident. Among CEOs in the smallest revenue cohort, personal and home security was reported for a mere 0.5%. This figure rises steadily with company size, reaching 60% among companies with at least $50 billion in annual revenue. For recipients in this largest group, the median disclosed spending on security was approximately $247,100.
Personal use of private aircraft is also part of this discussion, particularly at large corporations. Such use was reported for 48% of S&P 500 CEOs in 2026, up from 43% the previous year, and 17% of Russell 3000 CEOs, up from 15%. Notably, some boards now mandate or strongly encourage the use of company aircraft following security assessments, blurring the lines between convenience and protection. Despite the evolving rationale, personal use remains reportable compensation, necessitating clear distinctions between business, security, and personal use.
Regulatory Outlook: Anticipating Disclosure Reforms
The future of executive compensation disclosure may undergo significant changes as the Securities and Exchange Commission (SEC) advances its agenda for disclosure reform. The SEC is currently reviewing Regulation S-K, including Item 402, which governs executive compensation disclosures. Separately, a May 2026 proposal aims to extend scaled disclosure accommodations to a broader range of non-accelerated filers.
The interplay between evolving regulatory requirements and persistent investor expectations will shape disclosure practices. Companies may find opportunities to streamline repetitive disclosures if regulations are relaxed, while still preserving the information essential for investors to understand material award decisions, payouts, or changes in plan design. For unusual compensation decisions, the explanatory value of detailed disclosures is likely to remain critical, even if regulatory minimums are reduced.
The SEC’s review of Item 402 could lead to simplification or restructuring of executive compensation disclosures. Proposed filer-status reforms might allow more issuers to qualify for scaled disclosure, potentially reducing reporting burdens. However, investor expectations for transparency regarding pay-for-performance alignment, target setting, and special awards are likely to persist, regardless of regulatory changes. Companies should proactively identify and retain decision-useful information that clearly explains key pay decisions, even if regulatory minimums are lowered.
Conclusion: Navigating a Landscape of Evolving Practices and Heightened Scrutiny
Executive compensation continued its upward trend in 2026, mirrored by a strengthening of shareholder support for compensation plans. The broad market has not witnessed a radical departure from established incentive structures; instead, evolution is occurring within familiar frameworks. A greater proportion of compensation is being delivered through equity, RSAs/RSUs are becoming more prevalent, stock options are declining, and above-target annual incentive outcomes are increasing.
The significance of outliers, however, remains a critical aspect of this landscape. Exceptional awards attract disproportionate scrutiny due to the diminished context provided by ordinary benchmarking. Furthermore, security arrangements are becoming significantly more common among the largest companies, moving them beyond the realm of conventional executive perks.
For compensation committees, the central challenge lies not just in the numbers themselves, but in the strategic decisions underpinning them. This includes establishing credible performance targets, designing proportionate awards, exercising discretion judiciously, and developing rationales that remain persuasive when assessed over multiple years of pay and performance. The ongoing dialogue between companies, investors, and regulators will continue to shape the future of executive compensation, emphasizing transparency, accountability, and a clear alignment of executive rewards with long-term shareholder value creation.
